|
Pajari, Matti
VTT Building and Transport, Kemistintie 3, P.O.Box 1805, FI–02044 VTT, Finland

VTT Research Notes 2292, April 2005, 47 p. + app. 15 p.
[in English]
ISBN 951–38–6709–9
(soft back ed.)
ISBN 951–38–6552–5 (PDF edition)
Project: Shear resistance of prestressed hollow core slabs
Commissioned by Confederation of Finnish Construction Industries RT, VTT Technical Research Centre of Finland
Keywords: hollow core slab, prestress, shear, test, resistance,concrete, precast, structure, design, Eurocode
Abstract
Eurocode 2 presents a design method for the shear resistance, which according to harmonized standard EN 1168 is to be used
for the web shear failure of prestressed hollow core slabs. To check the validity of the method, 49 shear tests on hollow
core slabs with thickness 200–500 mm have been analysed.
The Eurocode 2 method overestimated the mean shear resistance of all tested slab types. For 200 mm slabs and slabs with flat
webs the overestimation was tens of percent. When the characteristic values of experimental and theoretical resistance were
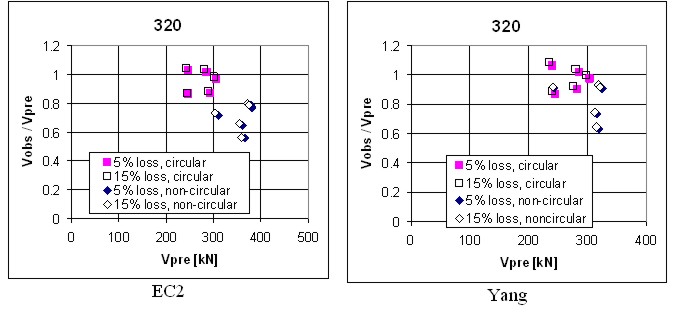
compared, the fit was better but there was still a considerable overestimation for 200 mm slabs and for the slabs with flat
webs. On the other hand, the Eurocode 2 method was (over)conservative for 265 mm and 320 mm slabs with circular voids.
The Eurocode 2 method ignores the shear stresses due to the transfer of the prestressing force. When these stresses were taken
into account applying Yang’s method, the accuracy for 265 mm and 320 mm slabs with circular voids was the same as when using
the Eurocode 2 method but much better for the other slabs.
Based on the results of the comparison, Yang’s method for design against web shear failure should replace the present method
in Eurocode 2. It is not acceptable, however, to adopt a design method which overestimates the characteristic resistance of
some product type by 10% as Yang’s method seems to do. Whether this is really the case, is still an open question because
the number of tests on the problematic slabs was small. Furthermore, due to the nature of the type approval tests, some test
specimens may have been weaker than the slabs typical of normal production.
The Eurocode 2 method should not be used for slabs with flat webs without a reduction factor, and its applicability to other
slab types should always be verified either numerically of experimentally before it is used.
Contents
Abstract
Preface
List of symbols
1. Introduction
2. Design against web shear failure
2.1 Failure criterion
2.2 Shear resistance, traditional approach
2.3 Shear resistance, Yang’s method
3. Tests
4. Analysis of test results
4.1 Assumptions
4.1.1 Material behaviour
4.1.2 Geometry
4.2 Comparison of predicted and observed resistance
4.2.1 Predicted resistance calculated using mean tensile strength
4.2.2 Predicted resistance calculated using characteristic tensile strength
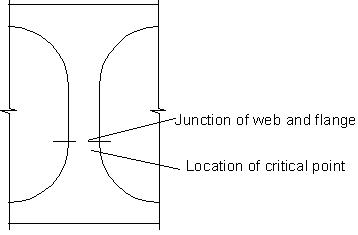
4.2.3 Location of critical point
5. Discussion
5.1 Assesment of tests
5.2 Results from other researchers
5.3 Mean or characteristic resistance?
5.4 Comparison of EC2 vs. Yang´s method
6. Summary and conclusions
References
Appendices
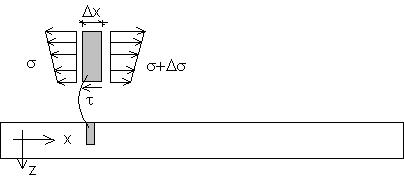
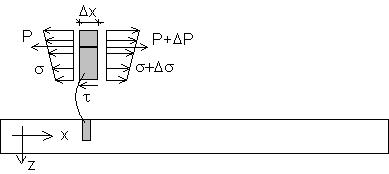
Appendix A: Expression for shear stress
Appendix B: Criterion for bond slip
Appendix C: Data about tests
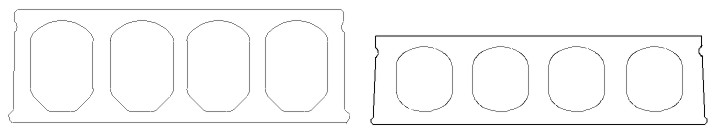
Figures and Tables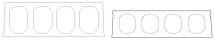 Figure. 1. Typical slab cross-sections with non-circular voids used in Finland. 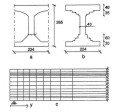 Figure 2. a) Cross-section of one web and the flanges on both sides. b) Approximate cross-section for two dimensional FEM-model. c)
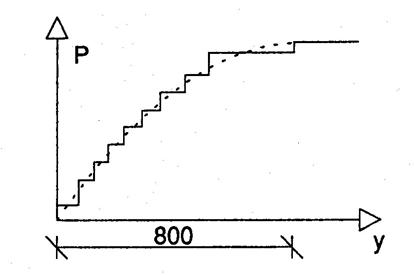
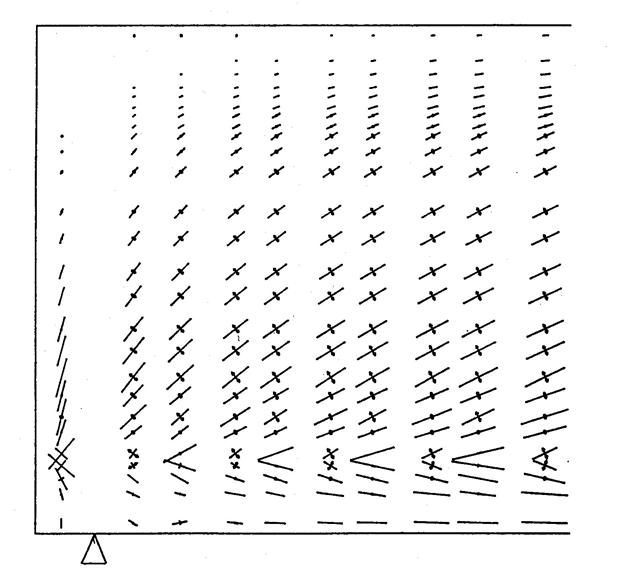
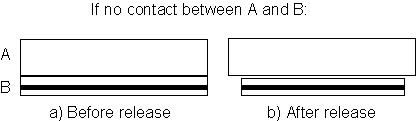
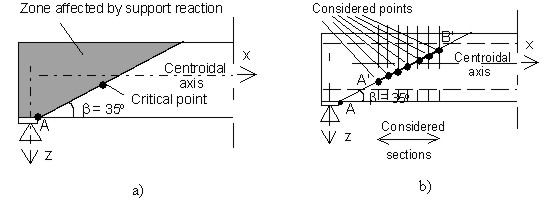
Side view on FEM-model. There is a vertical point load at the right end of the model corresponding to 200 kN / 1,2 m.  Figure 3. Assumed transfer of prestressing force (dashed line) and as modelled (continuous stepwise line). 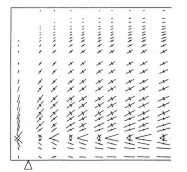 Figure 4. Principal stresses illustrated as vectors. Tensile stresses are indicated by arrows. 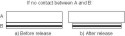 Figure 5. Illustration of what happens without shear stresses at the release of the prestressing force. 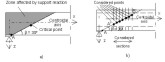 Figure 6. a) Possible location of critical point next to the zone affected by support reaction. b) Points and sections taken into
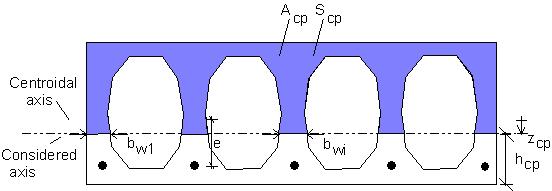
consideration in calculations.  Figure 7. Illustration of geometric parameters of considered cross-section.
Table 1. Number of acceptable and excluded tests.
|
Thickness
mm
|
Accepted tests
|
Rejected tests
|
Note
|
|
200
|
4
|
5
|
|
|
265
|
20
|
7
|
|
|
320
|
10
|
4
|
5 with circular, 5 with non-circular voids
|
|
370
|
2
|
3
|
|
|
400
|
7
|
2
|
|
|
500
|
6
|
2
|
|
|
Total
|
49
|
23 (32%)
|
|
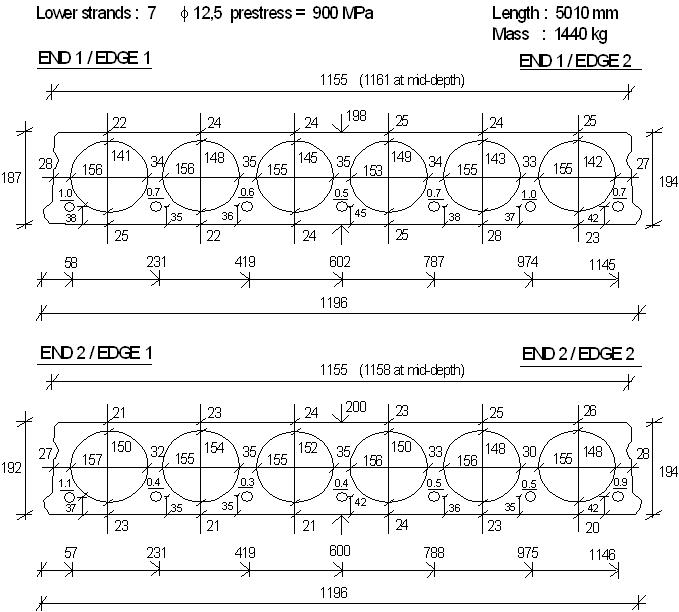
 Figure 8. Cross-sectional characteristics measured for each slab unit.
Table 2. Types, parameters, depths and core codes for tested slab cross-sections of type 1–3.
|
Type
|
Parameters
|
Depth
mm
|
Core code
|
|
1
|

|
200
|
601
602
|
|
1
|

|
265
|
501
502
503
|
|
1
|

|
320
|
401
|
|
2
|

|
320
370
400
|
410
411
412
413
414
415
|
|
3
|

|
400
|
416
|
Table 3. Types, parameters, depths and core codes for tested slab cross-sections of type 4 and 5.
|
Type
|
Parameters
|
Depth
mm
|
Core code
|
|
4
|

|
320
|
421
|
|
5
|

|
500
|
422
|
Table 4. Nominal values in millimetres for parameters shown in Table 3.
|
Code
|
H
|
b1
|
b2
|
b3
|
b4
|
r1
|
r2
|
h1
|
h2
|
h3
|
h4
|
h5
|
h6
|
h7
|
h8
|
|
601
|
200
|
150
|
0
|
0
|
0
|
0
|
0
|
25
|
0
|
0
|
0
|
0
|
0
|
0
|
0
|
|
602
|
200
|
155
|
0
|
0
|
0
|
0
|
0
|
25
|
0
|
0
|
0
|
0
|
0
|
0
|
0
|
|
501
|
265
|
185
|
0
|
0
|
0
|
0
|
0
|
40
|
0
|
0
|
0
|
0
|
0
|
0
|
0
|
|
502
|
265
|
191
|
0
|
0
|
0
|
0
|
0
|
39,5
|
0
|
0
|
0
|
0
|
0
|
0
|
0
|
|
503
|
320
|
185
|
0
|
0
|
0
|
0
|
0
|
67,5
|
0
|
0
|
0
|
0
|
0
|
0
|
0
|
|
401
|
320
|
229
|
0
|
0
|
0
|
0
|
0
|
40,5
|
0
|
0
|
0
|
0
|
0
|
0
|
0
|
|
410
|
320
|
220
|
0
|
0
|
0
|
122
|
122
|
38
|
69,24
|
105,52
|
69,24
|
0
|
0
|
0
|
0
|
|
411
|
320
|
222
|
0
|
0
|
0
|
123
|
123
|
36
|
70
|
106
|
70
|
0
|
0
|
0
|
0
|
|
412
|
370
|
220
|
0
|
0
|
0
|
122
|
122
|
63
|
69,24
|
105,52
|
69,24
|
0
|
0
|
0
|
0
|
|
413
|
400
|
225
|
0
|
0
|
0
|
112,5
|
112,5
|
40
|
112,5
|
95
|
112,5
|
0
|
0
|
0
|
0
|
|
414
|
400
|
223
|
0
|
0
|
0
|
111,5
|
111,5
|
35
|
111,5
|
102
|
111,5
|
0
|
0
|
0
|
0
|
|
415
|
400
|
222
|
0
|
0
|
0
|
123
|
123
|
36
|
70
|
186
|
70
|
0
|
0
|
0
|
0
|
|
416
|
400
|
221
|
97
|
0
|
0
|
125
|
0
|
40
|
62
|
191,44
|
66,56
|
0
|
0
|
0
|
0
|
|
421
|
320
|
229
|
0
|
41
|
0
|
126
|
126
|
35
|
73,41
|
103,2
|
73,41
|
84
|
71
|
21,57
|
0
|
|
422
|
500
|
215
|
70
|
40
|
86
|
120
|
0
|
48
|
72,5
|
248
|
66,67
|
50,5
|
250,36
|
80
|
6,86
|
Table 5. Load types.
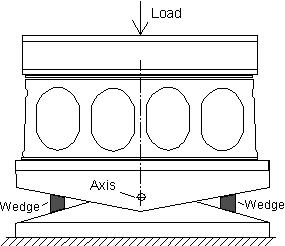
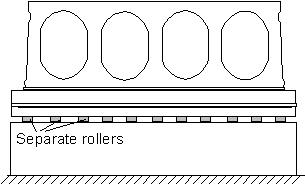
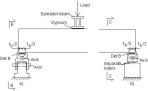 Figure 9. Side view on loading arrangements. For Det B see Figure 10. 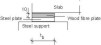 Figure 10. Arrangement at support.  Figure 11. The wedges are loose when placing the slab into position to allow for initial longitudinal spirality. They are tightened
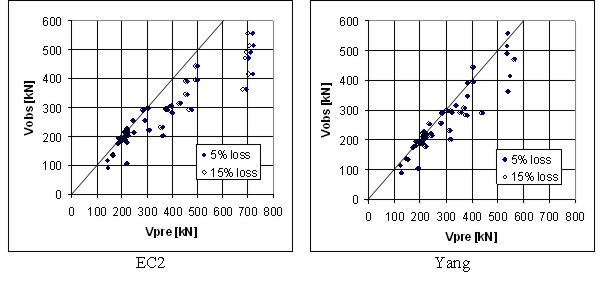
before the test.  Figure 12. Separate rollers at passive end. 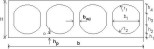 Figure 13. Geometrical model of slab cross-section in analysis. The measures printed in bold font are measured values, the other measures
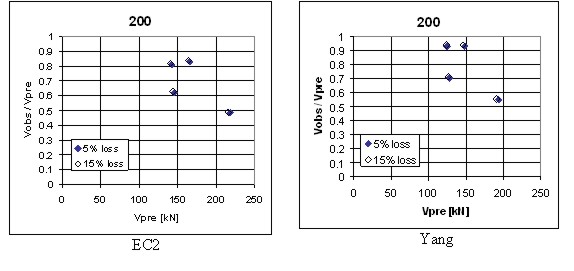
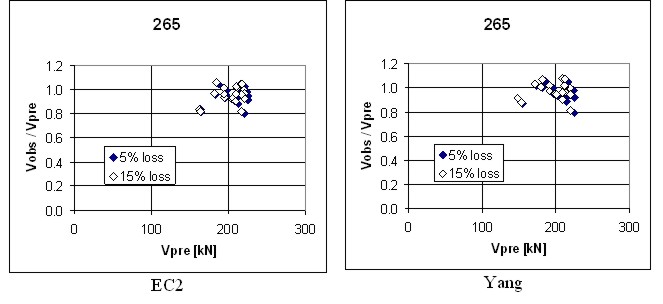
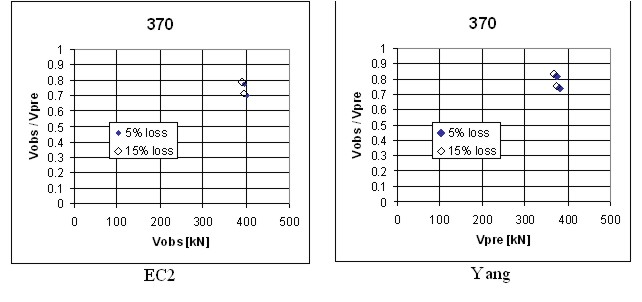
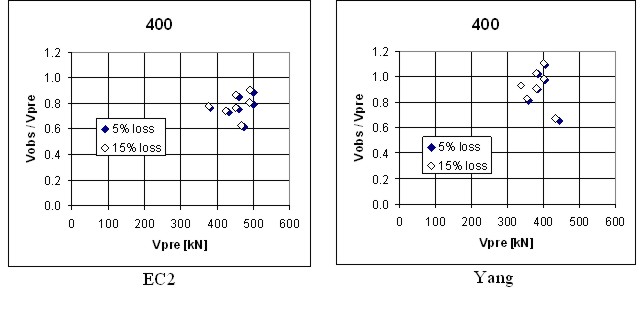
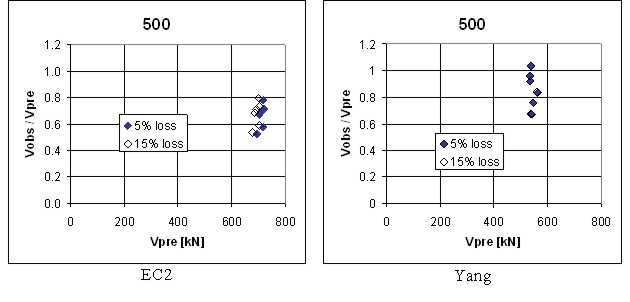
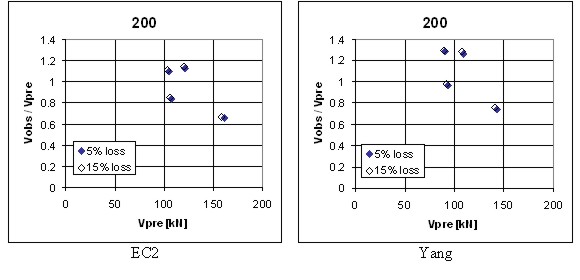
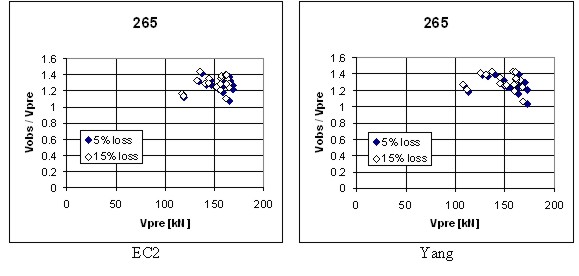
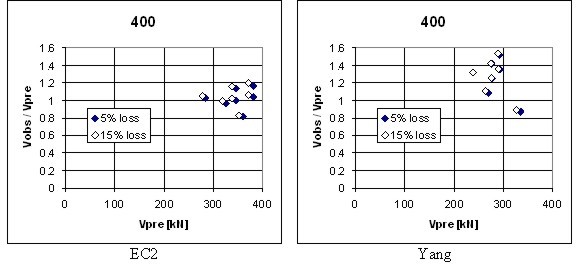
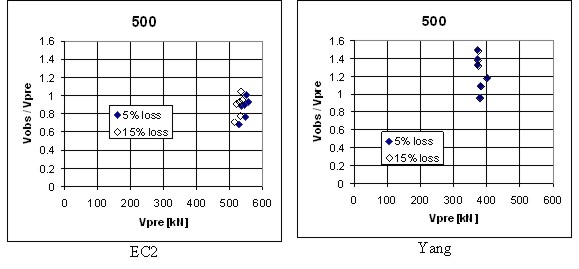
nominal ones. 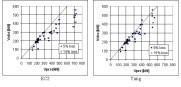 Figure 14. 200 mm slabs. Reelationship of observed (Vobs) and predicted resistance (Vpre) calculated using mean tensile strength and the approach of EC2 and Yang. 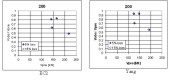 Figure 15. 200 mm slabs. Ratio of observed (Vobs) to predicted resistance (Vpre) calculated using mean tensile strength and the approach of EC2 and Yang. 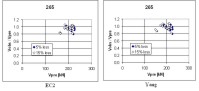 Figure 16. 265 mm slabs. Ratio of observed (Vobs) to predicted resistance (Vpre) calculated using mean tensile strength and the approach of EC2 or Yang. 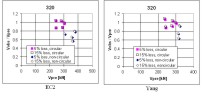 Figure 17. 320 mm slabs. Ratio of observed (Vobs) to predicted resistance (Vpre) calculated using mean tensile strength and the approach of EC2 or Yang. 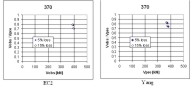 Figure 18. 370 mm slabs. Ratio of observed (Vobs) to predicted resistance (Vpre) calculated using mean tensile strength and the approach of EC2 and Yang.  Figure 19. 400 mm slabs. Ratio of observed (Vobs) to predicted resistance (Vpre) calculated using mean tensile strength and the approach of EC2 and Yang. 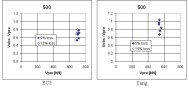 Figure 20. 500 mm slabs. Ratio of observed (Vobs) to predicted resistance (Vpre) calculated using mean tensile strength and the approach of EC2 and Yang. 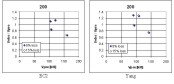 Figure 21. 200 mm slabs. Ratio of observed (Vobs) to predicted resistance (Vpre) calculated using characteristic tensile strength and the approach of EC2 and Yang. 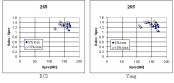 Figure 22. 265 mm slabs. Ratio of observed (Vobs) to predicted resistance (Vpre) calculated using characteristic tensile strength and the approach of EC2 and Yang. 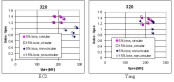 Figure 23. 320 mm slabs. Ratio of observed (Vobs) to predicted resistance (Vpre) calculated using characteristic tensile strength and the approach of EC2 and Yang. 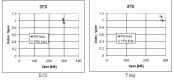 Figure 24. 370 mm slabs. Ratio of observed (Vobs) to predicted resistance (Vpre) calculated using characteristic tensile strength and the approach of EC2 and Yang. 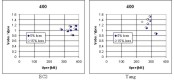 Figure 25. 400 mm slabs. Ratio of observed (Vobs) to predicted resistance (Vpre) calculated using characteristic tensile strength and the approach of EC2 and Yang. 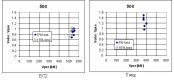 Figure 26. 500 mm slabs. Ratio of observed (Vobs) to predicted resistance (Vpre) calculated using characteristic tensile strength and the approach of EC2 and Yang.
Table 6. Calibration factors for different slab groups when using EC2 (c5%,EC2) and Yang’s method (c5%,Yang).
|
Slab thickness mm
|
Number of tests
|
c5%,EC2
|
c5%,Yang
|
|
200
|
4
|
0,571)
|
0,642)
|
|
265
|
20
|
1,13
|
1,14
|
|
320 (All)
|
10
|
0,75
|
0,94
|
|
320 (Circular)
|
5
|
1,14
|
1,12
|
|
320 (Non-circular)
|
5
|
0,723)
|
0,824)
|
|
370
|
2
|
-
|
-
|
|
400
|
7
|
0,84
|
0,92
|
|
500
|
6
|
0,68
|
0,91
|
|
400 + 500
|
13
|
0,73
|
0,93
|
|
320–500 with non-circular voids
|
18
|
0,75
|
0,88
|
|
All
|
49
|
0,79
|
0,96
|
Table 7. 200 mm slabs. Observed shear resistance Vobs, observed failure mode FMobs, predicted failure mode FMpre, initial prestress sp0, characteristic core strength fck,C50 and measured web width bw in the present and in some old tests [8].
|
|
Slab
|
Vobs
kN
|
FMobs1)
|
FMpre1)
|
sp0
MPa
|
fck,C50
MPa
|
bw
MPa
|
|
|
31.200
|
90
|
ST
|
ST
|
1100
|
48,5
|
239
|
|
Present
|
33.200
|
116
|
ST
|
ST
|
1100
|
47,5
|
238
|
|
tests
|
40.200
|
106
|
ST
|
ST
|
1100
|
70,2
|
293
|
|
|
63.200
|
137
|
S
|
ST
|
1000
|
52,5
|
262
|
|
|
44.2
|
>193
|
Interr.
|
ST
|
1100
|
48,8
|
242
|
|
|
51.2
|
135
|
S
|
SA
|
100
|
50,8
|
236
|
|
Old
|
56.2
|
140
|
S
|
F
|
900
|
51,7
|
266
|
|
tests
|
59.2
|
>148
|
SII
|
ST
|
1000
|
51,6
|
248
|
|
|
67.2
|
121
|
S
|
ST
|
1100
|
70,9
|
242
|
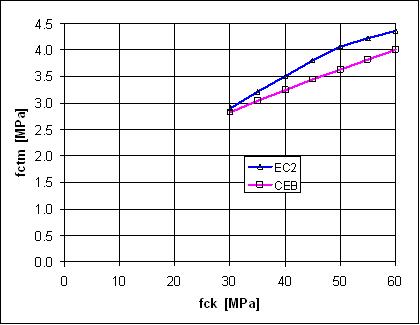
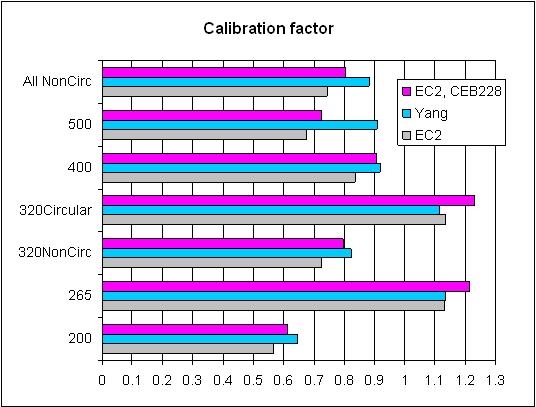
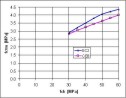 Figure 27. Comparison of mean tensile strength calculated according to EC2 and CEB Bulletin 228. 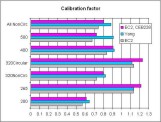 Figure 28. Calibration factor (c5%) needed to make the predicted resistance equal to the observed resistance when using EC2 method, Yang´s method and modified
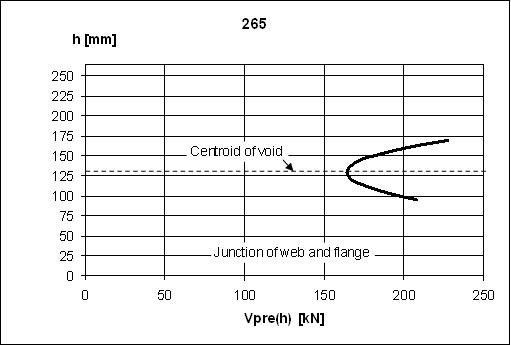
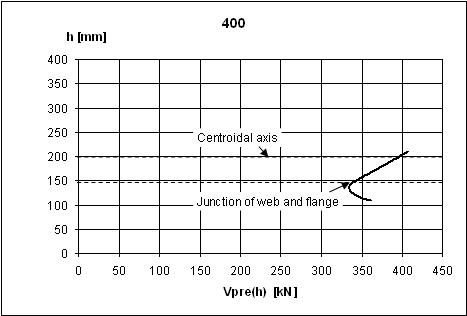
EC2 method applying reduced tensile strength (EC2, CEB228).  Figure 29. Slab 512.265, Yang’s method. Characteristic value of shear resistance corresponding to failure criterion at different depths
h. 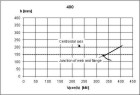 Figure 30. Slab 178.400, Yang’s method. Characteristic value of shear resistance corresponding to failure criterion at different depths
h. 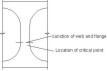 Figure 31. Slab 178.400, Yang’s method. Location of critical point.
Table 8. Mean value of ratios of observed shear resistance to predicted shear resistance.
|
Slab thickness [mm]
|
All
|
265
|
370–400
|
500
|
|
Yang (FIP [7])
|
0,92
|
1,13
|
0,86
|
-
|
|
Fellinger (EC2)
|
0,92
|
|
0,87*)
|
-
|
|
Present study (EC2)
|
0,83
|
0,95
|
0,77
|
0,67
|
 Figure A-1. Free body diagram for slabs without upper tendons. 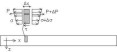 Figure A-2. Free body diagram for a slab with upper tendons.
Table 1. Test type, slab type, nominal depth of slab (H), number of upper strands (Nup), diameter of an upper strand (Dup), cross-sectional area of an upper strand (Aup), initial prestress in upper strands (sp0,up) and the corresponding characteristics for the lower strands (Nlow, Dlow , Alow , sp0,low).
|
Test
|
Test
|
Slab
|
H
|
Nup
|
Dup
|
Aup
|
sp0,up
|
Nlow
|
Dlow
|
Alow
|
sp0,low
|
|
|
type
|
type
|
mm
|
|
mm
|
mm2
|
MPa
|
|
mm
|
mm2
|
MPa
|
|
31.200
|
1
|
602
|
200
|
|
|
|
|
7
|
12,5
|
93
|
1100
|
|
33.200
|
1
|
602
|
200
|
|
|
|
|
7
|
12,5
|
93
|
1100
|
|
40.200
|
1
|
601
|
200
|
|
|
|
|
7
|
12,5
|
93
|
1100
|
|
63.200
|
1
|
601
|
200
|
|
|
|
|
7
|
12,5
|
93
|
1000
|
|
74.265
|
1
|
501
|
265
|
|
|
|
|
5
|
12,5
|
93
|
1100
|
|
98.265
|
1
|
501
|
265
|
|
|
|
|
10
|
12,5
|
93
|
1100
|
|
104.265
|
1
|
501
|
265
|
|
|
|
|
4
|
12,5
|
93
|
1000
|
|
107.265
|
1
|
501
|
265
|
|
|
|
|
4
|
12,5
|
93
|
1000
|
|
109.265
|
1
|
501
|
265
|
|
|
|
|
10
|
12,5
|
93
|
1000
|
|
110.265
|
1
|
502
|
265
|
|
|
|
|
8
|
12,5
|
93
|
1000
|
|
113.265
|
1
|
502
|
265
|
2
|
9,3
|
52
|
900
|
4
|
12,5
|
93
|
1000
|
|
114.265
|
1
|
502
|
265
|
2
|
9,3
|
52
|
900
|
8
|
12,5
|
93
|
900
|
|
115.265
|
1
|
502
|
265
|
|
|
|
|
6
|
12,5
|
93
|
1000
|
|
116.265
|
4
|
501
|
265
|
|
|
|
|
6
|
12,5
|
93
|
1100
|
|
501.265
|
5
|
501
|
265
|
0
|
|
|
|
10
|
12,5
|
93
|
1100
|
|
502.265
|
5
|
501
|
265
|
0
|
|
|
|
10
|
12,5
|
93
|
1100
|
|
503.265
|
5
|
501
|
265
|
0
|
|
|
|
10
|
12,5
|
93
|
950
|
|
504.265
|
5
|
501
|
265
|
0
|
|
|
|
10
|
12,5
|
93
|
950
|
|
505.265
|
5
|
501
|
265
|
0
|
|
|
|
10
|
12,5
|
93
|
950
|
|
506.265
|
5
|
501
|
265
|
0
|
|
|
|
10
|
12,5
|
93
|
950
|
|
507.265
|
5
|
501
|
265
|
0
|
|
|
|
10
|
12,5
|
93
|
950
|
|
508.265
|
5
|
501
|
265
|
0
|
|
|
|
10
|
12,5
|
93
|
950
|
|
509.265
|
5
|
501
|
265
|
0
|
|
|
|
10
|
12,5
|
93
|
950
|
|
510.265
|
5
|
501
|
265
|
0
|
|
|
|
10
|
12,5
|
93
|
950
|
|
511.265
|
5
|
501
|
265
|
0
|
|
|
|
10
|
12,5
|
93
|
950
|
|
512.265
|
5
|
501
|
265
|
0
|
|
|
|
10
|
12,5
|
93
|
950
|
|
132.320
|
3
|
503
|
320
|
|
|
|
|
10
|
12,5
|
93
|
1100
|
|
133.320
|
3
|
503
|
320
|
|
|
|
|
12
|
12,5
|
93
|
1100
|
|
134.320
|
3
|
503
|
320
|
|
|
|
|
12
|
12,5
|
93
|
1100
|
|
136.320
|
4
|
410
|
320
|
|
|
|
|
4
|
12,5
|
93
|
1000
|
|
138.320
|
4
|
410
|
320
|
|
|
|
|
13
|
12,5
|
93
|
1000
|
|
139.320
|
4
|
410
|
320
|
|
|
|
|
7
|
12,5
|
93
|
1000
|
|
146.320
|
1
|
401
|
320
|
|
|
|
|
6
|
12,5
|
93
|
1000
|
|
148.320
|
1
|
401
|
320
|
2
|
9,3
|
52
|
900
|
11
|
12,5
|
93
|
1000
|
|
151.320
|
1
|
401
|
320
|
|
|
|
|
9
|
12,5
|
93
|
950
|
|
513.320
|
5
|
421
|
320
|
2
|
12,5
|
93
|
900
|
13
|
12,5
|
93
|
1100
|
|
514.320
|
5
|
411
|
320
|
0
|
|
|
|
13
|
12,5
|
93
|
1100
|
|
515.320
|
5
|
411
|
320
|
0
|
|
|
|
13
|
12,5
|
93
|
1100
|
|
516.320
|
5
|
421
|
320
|
0
|
|
|
|
11
|
12,5
|
93
|
1000
|
|
517.320
|
5
|
421
|
320
|
0
|
|
|
|
11
|
12,5
|
93
|
1000
|
Table 1. Continued.
|
Test
|
Test
|
Slab
|
H
|
Nup
|
Dup
|
Aup
|
sp0,up
|
Nlow
|
Dlow
|
Alow
|
sp0,low
|
|
|
type
|
type
|
mm
|
|
mm
|
mm2
|
MPa
|
|
mm
|
mm2
|
MPa
|
|
159.370
|
3
|
412
|
370
|
|
|
|
|
10
|
12,5
|
93
|
1000
|
|
160.370
|
3
|
412
|
370
|
|
|
|
|
12
|
12,5
|
93
|
1000
|
|
161.370
|
3
|
412
|
370
|
|
|
|
|
12
|
12,5
|
93
|
1000
|
|
162.400
|
1
|
415
|
400
|
|
|
|
|
12
|
12,5
|
93
|
1100
|
|
178.400
|
1
|
414
|
400
|
|
|
|
|
13
|
12,5
|
93
|
1100
|
|
179.400
|
4
|
414
|
400
|
|
|
|
|
5
|
12,5
|
93
|
1000
|
|
180.400
|
4
|
414
|
400
|
|
|
|
|
13
|
12,5
|
93
|
1000
|
|
188.400
|
1
|
413
|
400
|
|
|
|
|
9
|
12,5
|
93
|
1000
|
|
518.400
|
5
|
416
|
400
|
0
|
|
|
|
13
|
12,5
|
93
|
1000
|
|
519.400
|
5
|
416
|
400
|
0
|
|
|
|
13
|
12,5
|
93
|
1000
|
|
520.400
|
5
|
416
|
400
|
0
|
|
|
|
11
|
12,5
|
93
|
1100
|
|
521.400
|
6
|
416
|
400
|
0
|
|
|
|
11
|
12,5
|
93
|
1100
|
|
191.500
|
2
|
422
|
500
|
|
|
|
|
16
|
12,5
|
93
|
1000
|
|
193.500
|
3
|
422
|
500
|
|
|
|
|
16
|
12,5
|
93
|
1000
|
|
194.500
|
3
|
422
|
500
|
|
|
|
|
18
|
12,5
|
93
|
1000
|
|
195.500
|
3
|
422
|
500
|
|
|
|
|
18
|
12,5
|
93
|
1000
|
|
198.500
|
3
|
422
|
500
|
|
|
|
|
16
|
12,5
|
93
|
1000
|
|
199.500
|
3
|
422
|
500
|
|
|
|
|
21
|
12,5
|
93
|
1000
|
|
200.500
|
3
|
422
|
500
|
|
|
|
|
21
|
12,5
|
93
|
1000
|
|
201.500
|
3
|
422
|
500
|
|
|
|
|
21
|
12,5
|
93
|
1000
|
Table 2. Length, span and mass of slab, length of bearing (tb), shear span (a) and distance between two line loads (a1), average depth of section (Have), average web width (bw = sum of individual web widths bw,i), average depth of hollow core (Ho), average thickness of concrete below hollow core (tlow),average distance from lower strands to the soffit (dp,low) and from upper strand to the top fibre (dp,up).
|
Test
|
Length
|
Span
|
Mass
|
tb
|
a(/a1)
|
Have
|
bave
|
bw
|
Ho
|
tlow
|
dp,low
|
dp,up
|
|
|
mm
|
mm
|
kg
|
mm
|
mm
|
mm
|
mm
|
mm
|
mm
|
mm
|
mm
|
mm
|
|
31.200
|
6643
|
6603
|
2000
|
40
|
917
|
200
|
1162
|
239
|
153
|
19
|
39
|
|
|
33.200
|
4998
|
4958
|
1490
|
40
|
689
|
202
|
1163
|
238
|
157
|
19
|
40
|
|
|
40.200
|
6257
|
6217
|
2290
|
40
|
863
|
202
|
1158
|
293
|
138
|
34
|
39
|
|
|
63.200
|
4006
|
3966
|
1250
|
40
|
551
|
202
|
1158
|
262
|
144
|
20
|
38
|
|
|
74.265
|
5199
|
5159
|
2230
|
40
|
717
|
257
|
1156
|
219
|
184
|
43
|
40
|
|
|
98.265
|
5253
|
5213
|
2240
|
40
|
724
|
260
|
1157
|
228
|
175
|
42
|
36
|
|
|
104.265
|
5004
|
4964
|
2280
|
40
|
689
|
268
|
1158
|
244
|
172
|
41
|
45
|
|
|
107.265
|
5007
|
4967
|
2210
|
40
|
690
|
255
|
1158
|
239
|
171
|
41
|
39
|
|
|
109.265
|
4997
|
4957
|
2160
|
40
|
688
|
262
|
1157
|
242
|
174
|
34
|
39
|
|
|
110.265
|
5015
|
4975
|
2160
|
40
|
691
|
261
|
1158
|
220
|
177
|
43
|
32
|
|
|
113.265
|
4997
|
4957
|
2220
|
40
|
688
|
267
|
1155
|
226
|
176
|
41
|
34
|
|
|
114.265
|
5285
|
5245
|
2280
|
40
|
728
|
265
|
1159
|
232
|
171
|
36
|
34
|
40
|
|
115.265
|
4963
|
4923
|
2000
|
40
|
684
|
258
|
1156
|
215
|
183
|
31
|
40
|
|
|
116.265
|
4507
|
4457
|
1920
|
50
|
663
|
270
|
1160
|
222
|
|
|
45
|
|
|
501.265
|
5501
|
4000
|
2310
|
75
|
968
|
259
|
1153
|
224
|
186
|
38
|
41
|
|
|
502.265
|
5501
|
4000
|
2310
|
75
|
968
|
259
|
1153
|
224
|
186
|
38
|
41
|
|
|
503.265
|
6000
|
5940
|
2560
|
60
|
970
|
260
|
1161
|
221
|
180
|
38
|
34
|
|
|
504.265
|
6000
|
4940
|
2560
|
60
|
970
|
260
|
1161
|
221
|
180
|
38
|
34
|
|
|
505.265
|
5998
|
5938
|
2500
|
60
|
970
|
260
|
1157
|
216
|
183
|
39
|
35
|
|
|
506.265
|
5998
|
5000
|
2500
|
60
|
970
|
260
|
1157
|
216
|
183
|
39
|
35
|
|
|
507.265
|
5995
|
5935
|
2520
|
60
|
970
|
263
|
1156
|
218
|
182
|
36
|
37
|
|
|
508.265
|
5995
|
5000
|
2520
|
60
|
970
|
263
|
1156
|
218
|
182
|
36
|
37
|
|
|
509.265
|
5996
|
5936
|
2450
|
60
|
970
|
184
|
1155
|
217
|
184
|
34
|
36
|
|
|
510.265
|
5996
|
5000
|
2450
|
60
|
970
|
184
|
1155
|
217
|
184
|
34
|
36
|
|
|
511.265
|
5999
|
5940
|
2610
|
60
|
1170
|
263
|
1150
|
221
|
176
|
40
|
40
|
|
|
512.265
|
6001
|
5940
|
2680
|
60
|
1170
|
262
|
1150
|
223
|
174
|
40
|
39
|
|
|
132.320
|
7002
|
6942
|
4200
|
60
|
810/300
|
311
|
1165
|
254
|
161
|
64
|
42
|
|
|
133.320
|
6995
|
6935
|
4310
|
60
|
810/300
|
322
|
1160
|
261
|
164
|
70
|
48
|
|
|
134.320
|
6990
|
6930
|
4330
|
60
|
970/300
|
327
|
1161
|
243
|
174
|
68
|
47
|
|
|
136.320
|
5009
|
4959
|
2410
|
50
|
800
|
321
|
|
313
|
|
|
42
|
|
|
138.320
|
6990
|
6940
|
3410
|
50
|
800
|
321
|
|
299
|
|
|
41
|
|
|
139.320
|
7001
|
6951
|
3470
|
50
|
800
|
320
|
|
304
|
|
|
40
|
|
|
146.320
|
5890
|
5850
|
3060
|
40
|
813
|
303
|
1154
|
256
|
211
|
44
|
33
|
|
|
148.320
|
5985
|
5945
|
3100
|
40
|
826
|
310
|
1149
|
263
|
213
|
40
|
51
|
49
|
|
151.320
|
6003
|
5963
|
3060
|
40
|
828
|
311
|
1163
|
270
|
211
|
46
|
48
|
|
|
513.320
|
9594
|
9527
|
4360
|
70
|
1265
|
319
|
1162
|
258
|
243
|
36
|
51
|
22
|
|
514.320
|
7198
|
7118
|
3810
|
80
|
1160
|
315
|
1165
|
309
|
222
|
38
|
43
|
|
|
515.320
|
7200
|
7120
|
3800
|
80
|
1160
|
314
|
1165
|
311
|
222
|
38
|
42
|
|
|
516.320
|
7995
|
5800
|
3880
|
80
|
760
|
321
|
1153
|
289
|
216
|
36
|
38
|
|
|
517.320
|
7991
|
5800
|
3830
|
80
|
760
|
321
|
1153
|
287
|
216
|
37
|
39
|
|
Table 2. Continued.
|
Test
|
Length
|
Span
|
Mass
|
tb
|
a(/a1)
|
Have
|
bave
|
bw
|
Ho
|
tlow
|
dp,low
|
dp,up
|
|
|
mm
|
mm
|
kg
|
mm
|
mm
|
mm
|
mm
|
mm
|
mm
|
mm
|
mm
|
mm
|
|
159.370
|
6994
|
6934
|
4060
|
60
|
960/300
|
358
|
1144
|
270
|
236
|
56
|
39
|
|
|
160.370
|
7002
|
6942
|
4060
|
60
|
960/300
|
359
|
1145
|
272
|
237
|
54
|
40
|
|
|
161.370
|
6993
|
6933
|
4070
|
60
|
1145/300
|
357
|
1145
|
276
|
234
|
57
|
39
|
|
|
162.400
|
10017
|
9937
|
5480
|
80
|
1380
|
397
|
1172
|
284
|
306
|
41
|
53
|
|
|
178.400
|
7626
|
7546
|
4510
|
80
|
1048
|
402
|
1158
|
286
|
299
|
49
|
38
|
|
|
179.400
|
6496
|
6406
|
3670
|
90
|
1000
|
402
|
|
262
|
|
|
35
|
|
|
180.400
|
6988
|
6898
|
4100
|
90
|
1000
|
405
|
|
278
|
|
|
46
|
|
|
188.400
|
8000
|
7920
|
4430
|
80
|
1100
|
407
|
1161
|
285
|
312
|
48
|
39
|
|
|
518.400
|
8390
|
8290
|
4580
|
100
|
1150
|
390
|
1152
|
293
|
310
|
38
|
41
|
|
|
519.400
|
8390
|
7150
|
4580
|
100
|
1150
|
390
|
1152
|
293
|
310
|
38
|
41
|
|
|
520.400
|
5504
|
4000
|
3010
|
75
|
968
|
396
|
1152
|
291
|
307
|
41
|
36
|
|
|
521.400
|
5504
|
4000
|
3010
|
75
|
968
|
396
|
1152
|
291
|
307
|
41
|
36
|
|
|
191.500
|
10995
|
10915
|
7640
|
80
|
1364
|
498
|
1169
|
325
|
400
|
40
|
53
|
|
|
193.500
|
8470
|
8390
|
5960
|
80
|
1350/300
|
500
|
1163
|
335
|
399
|
43
|
56
|
|
|
194.500
|
8499
|
8419
|
5820
|
80
|
1350/300
|
501
|
1169
|
312
|
405
|
36
|
58
|
|
|
195.500
|
8495
|
8415
|
5920
|
80
|
1350/300
|
496
|
1163
|
331
|
396
|
39
|
49
|
|
|
198.500
|
8492
|
8412
|
6000
|
80
|
1475/300
|
503
|
1167
|
324
|
398
|
40
|
47
|
|
|
199.500
|
8516
|
8436
|
6080
|
80
|
1350/300
|
497
|
1177
|
326
|
392
|
42
|
52
|
|
|
200.500
|
8510
|
8430
|
6120
|
80
|
1475/300
|
494
|
1171
|
327
|
396
|
43
|
53
|
|
|
201.500
|
8512
|
8432
|
6040
|
80
|
1600/300
|
495
|
1174
|
322
|
398
|
42
|
51
|
|
Table 3. Two largest slippages in upper strands (S1,up, S2,up), four largest slippages in lower strands (S1, S2, S3, S4), measured mean core strength (fC50,mean) and standard deviation of the measured core strength (dC50).
|
Slab
|
S1,up
|
S2,up
|
S1
|
S2
|
S3
|
S4
|
fC50,mean
|
dC50
|
|
|
mm
|
mm
|
mm
|
mm
|
mm
|
mm
|
MPa
|
MPa
|
|
31.200
|
|
|
0,4
|
0,4
|
0,3
|
0,3
|
54,8
|
3,8
|
|
33.200
|
|
|
0,4
|
0,3
|
0,2
|
0,2
|
52,8
|
3,2
|
|
40.200
|
|
|
1,0
|
0,8
|
0,5
|
0,4
|
76,5
|
3,8
|
|
63.200
|
|
|
0,6
|
0,4
|
0,4
|
0,4
|
56,6
|
2,5
|
|
74.265
|
|
|
1,0
|
0,6
|
0,6
|
0,6
|
77,9
|
3,2
|
|
98.265
|
|
|
1,1
|
1,0
|
1,0
|
0,9
|
71,3
|
4,2
|
|
104.265
|
|
|
1,0
|
0,5
|
0,5
|
0,4
|
47,6
|
4,0
|
|
107.265
|
|
|
1,0
|
1,0
|
0,6
|
0,3
|
47,9
|
3,1
|
|
109.265
|
|
|
2,2
|
1,3
|
1,1
|
1,0
|
56,7
|
3,0
|
|
110.265
|
|
|
0,7
|
0,7
|
0,6
|
0,6
|
56,5
|
2,6
|
|
113.265
|
|
|
0,8
|
0,5
|
0,5
|
0,4
|
61,9
|
2,5
|
|
114.265
|
0,2
|
0,1
|
0,6
|
0,5
|
0,4
|
0,4
|
60,2
|
2,7
|
|
115.265
|
|
|
0,9
|
0,8
|
0,6
|
0,5
|
63,2
|
4,9
|
|
116.265
|
|
|
0,7
|
0,6
|
0,5
|
0,5
|
58,31)
|
-
|
|
501.265
|
|
|
1
|
0,8
|
0,7
|
0,6
|
67,1
|
2,4
|
|
502.265
|
|
|
1
|
0,8
|
0,7
|
0,6
|
67,1
|
2,4
|
|
503.265
|
|
|
1,2
|
1,1
|
1,1
|
1,1
|
72
|
4,9
|
|
504.265
|
|
|
1,2
|
1,1
|
1,1
|
1,1
|
72
|
4,9
|
|
505.265
|
|
|
1,7
|
1,5
|
1,4
|
1,2
|
70,8
|
4,3
|
|
506.265
|
|
|
1,7
|
1,5
|
1,4
|
1,2
|
70,8
|
4,3
|
|
507.265
|
|
|
2,3
|
1,7
|
1,4
|
1,2
|
682)
|
8,1
|
|
508.265
|
|
|
2,3
|
1,7
|
1,4
|
1,2
|
682
|
8,1)
|
|
509.265
|
|
|
1,3
|
1,3
|
1
|
1
|
65,8
|
2,1
|
|
510.265
|
|
|
1,3
|
1,3
|
1
|
1
|
65,8
|
2,1
|
|
511.265
|
|
|
1,3
|
0,9
|
0,8
|
0,7
|
67,8
|
2,5
|
|
512.265
|
|
|
1,2
|
0,7
|
0,6
|
0,6
|
67,8
|
2,9
|
|
132.320
|
|
|
0,9
|
0,7
|
0,6
|
0,5
|
|
|
|
133.320
|
|
|
1,5
|
1,3
|
1,3
|
1,3
|
68,0
|
1,9
|
|
134.320
|
|
|
1,3
|
1,2
|
1,1
|
1,0
|
68,0
|
1,9
|
|
136.320
|
|
|
0,8
|
0,5
|
0,4
|
0,3
|
|
|
|
138.320
|
|
|
1,2
|
1,1
|
1,0
|
0,9
|
|
|
|
139.320
|
|
|
1,1
|
0,7
|
0,7
|
0,6
|
|
|
|
146.320
|
|
|
0,4
|
0,4
|
0,4
|
0,3
|
57,0
|
3,6
|
|
148.320
|
0,2
|
0,1
|
0,6
|
0,4
|
0,3
|
0,3
|
46,8
|
2,0
|
|
151.320
|
|
|
0,6
|
0,5
|
0,5
|
0,4
|
66,8
|
5,5
|
|
513.320
|
|
|
1,9
|
1,9
|
1,8
|
1,8
|
62,1
|
4,6
|
|
514.320
|
|
|
2,5
|
1,7
|
1,4
|
1,3
|
61,8
|
2,4
|
|
515.320
|
|
|
1,7
|
1,5
|
1,3
|
1,2
|
61,8
|
2,4
|
|
516.320
|
|
|
1
|
0,9
|
0,8
|
0,7
|
64,3
|
2,6
|
|
517.320
|
|
|
0,8
|
0,8
|
0,8
|
0,7
|
64,8
|
1,2
|
Table 3. Continued.
|
Slab
|
S1,up
|
S2,up
|
S1
|
S2
|
S3
|
S4
|
fC50,mean
|
dC50
|
|
|
mm
|
mm
|
mm
|
mm
|
mm
|
mm
|
MPa
|
MPa
|
|
159.370
|
|
|
1,4
|
1,1
|
0,8
|
0,7
|
|
|
|
160.370
|
|
|
0,6
|
0,5
|
0,5
|
0,5
|
72,2
|
2,1
|
|
161.370
|
|
|
0,5
|
0,5
|
0,5
|
0,5
|
72,2
|
2,1
|
|
162.400
|
|
|
1,4
|
1,0
|
0,8
|
0,8
|
65,2
|
5,0
|
|
178.400
|
|
|
1,3
|
1
|
0,9
|
0,8
|
71,5
|
4,0
|
|
179.400
|
|
|
1,5
|
0,9
|
0,6
|
0,6
|
|
|
|
180.400
|
|
|
2,3
|
1,7
|
1,7
|
1,5
|
|
|
|
188.400
|
|
|
1,0
|
0,8
|
0,5
|
0,5
|
55,5
|
2,9
|
|
518.400
|
|
|
1,9
|
1,1
|
0,9
|
0,9
|
67,3
|
1,7
|
|
519.400
|
|
|
1,9
|
1,1
|
0,9
|
0,9
|
67,3
|
1,7
|
|
520.400
|
|
|
1,6
|
1,6
|
1,5
|
1,5
|
64,2
|
2,5
|
|
521.400
|
|
|
1,6
|
1,6
|
1,5
|
1,5
|
64,2
|
2,5
|
|
191.500
|
|
|
0,9
|
0,9
|
0,7
|
0,7
|
70,8
|
1,1
|
|
193.500
|
|
|
0,9
|
0,9
|
0,8
|
0,8
|
70,8
|
1,1
|
|
194.500
|
|
|
1,5
|
1,2
|
1,0
|
0,7
|
67,31)
|
-
|
|
195.500
|
|
|
2,0
|
1,2
|
1,2
|
1,0
|
|
|
|
198.500
|
|
|
0,8
|
0,7
|
0,7
|
0,6
|
76,4
|
2,6
|
|
199.500
|
|
|
2,1
|
1,5
|
1,4
|
0,8
|
74,7
|
5,3
|
|
200.500
|
|
|
1,7
|
1,4
|
1,1
|
1,0
|
74,7
|
5,3
|
|
201.500
|
|
|
2,0
|
1,8
|
1,2
|
1,0
|
74,7
|
5,3
|
Table 4. Date of casting and loading, age at loading, load when first crack width (flexural) exceeds 0,2 mm (Pcr), load at failure (Pfail), shear force at loaded support due to self weight (Vg) and distance of crack from support on the top surface (c1) and at the bottom surface (c2). Both c1 and c2 are mean of two values measured on opposite edges of the slab.
|
Test
|
Date of
|
Date of
|
Age at
|
Pcr
|
Pfail
|
Vg
|
c1/c2
|
Note
|
|
|
casting
|
loading
|
loading [d]
|
kN
|
kN
|
kN
|
|
|
|
31.200
|
31.1.01
|
21.3.01
|
49
|
57,4
|
80,4
|
9,8
|
300/100
|
|
|
33.200
|
31.1.01
|
2.4.01
|
61
|
80,4
|
108,3
|
7,3
|
450/150
|
|
|
40.200
|
28.10.92
|
26.11.92
|
29
|
82,8
|
94,8
|
11,2
|
|
|
|
63.200
|
16.11.01
|
14.2.02
|
90
|
122,4
|
131,4
|
6,1
|
|
|
|
74.265
|
25.1.95
|
25.1.95
|
0
|
116,4
|
148,9
|
10,9
|
700/440
|
|
|
98.265
|
3.12.99
|
19.1.00
|
47
|
194,4
|
208,5
|
10,9
|
700/0
|
|
|
104.265
|
8.7.98
|
22.9.98
|
76
|
85,8
|
124,9
|
11,1
|
|
|
|
107.265
|
10.12.99
|
17.1.00
|
38
|
89,5
|
123,4
|
10,8
|
|
|
|
109.265
|
10.12.01
|
6.2.02
|
58
|
-
|
177,7
|
10,5
|
|
|
|
110.265
|
3.8.94
|
27.1.95
|
177
|
163,4
|
184,4
|
10,5
|
|
|
|
113.265
|
4.9.97
|
28.1.98
|
146
|
107,2
|
170,4
|
10,8
|
|
|
|
114.265
|
17.7.98
|
7.10.98
|
82
|
163,1
|
179,4
|
11,1
|
|
|
|
115.265
|
1.7.99
|
5.1.00
|
188
|
113,4
|
166,4
|
9,7
|
|
|
|
116.265
|
-
|
31.7.02
|
|
|
226,5
|
9,3
|
|
|
|
501.265
|
17.10.91
|
13.11.91
|
27
|
|
272,1
|
7,1
|
900/180
|
Strength measured 29.11.
|
|
502.265
|
17.10.91
|
13.11.91
|
27
|
|
261,1
|
7,1
|
900/120
|
Strength measured 29.11.
|
|
503.265
|
15.9.93
|
11.10.93
|
26
|
|
233,7
|
12,4
|
850/170
|
|
|
504.265
|
15.9.93
|
11.10.93
|
26
|
|
209,0
|
9,9
|
450/100
|
|
|
505.265
|
11.11.93
|
21.12.93
|
40
|
|
240,4
|
12,2
|
810/220
|
Strength measured 23.12.
|
|
506.265
|
11.11.93
|
21.12.93
|
40
|
|
256,4
|
9,8
|
540/70
|
Strength measured 23.12.
|
|
507.265
|
8.11.03
|
21.12.93
|
43
|
|
219,4
|
12,2
|
360/0
|
Strength measured 23.12.
|
|
508.265
|
8.11.03
|
21.12.93
|
43
|
|
219,4
|
9,9
|
390/0
|
Strength measured 23.12.
|
|
509.265
|
21.1.94
|
11.3.94
|
49
|
|
211,0
|
11,9
|
600/30
|
|
|
510.265
|
21.1.94
|
11.3.94
|
49
|
|
237,1
|
9,6
|
650/100
|
|
|
511.265
|
10.10.94
|
17.11.94
|
38
|
|
264,9
|
12,7
|
1100/30
|
|
|
512.265
|
10.10.94
|
17.11.94
|
38
|
|
266,5
|
13,0
|
1100/30
|
|
|
132.320
|
12.2.02
|
22.4.02
|
69
|
-
|
255,4
|
20,4
|
750/200
|
|
|
133.320
|
28.1.02
|
23.4.02
|
85
|
-
|
275,4
|
21,0
|
550/150
|
|
|
134.320
|
28.1.02
|
23.4.02
|
85
|
-
|
269,4
|
21,1
|
550/200
|
|
|
136.320
|
20.11.00
|
18.12.00
|
28
|
-
|
189,5
|
11,7
|
700/300
|
|
|
138.320
|
31.7.02
|
30.8.02
|
30
|
-
|
298,0
|
16,6
|
600/160
|
|
|
139.320
|
8.10.02
|
8.11.02
|
31
|
-
|
252,0
|
16,9
|
630/270
|
|
|
146.320
|
21.11.94
|
31.1.95
|
71
|
133,4
|
198,8
|
14,9
|
|
|
|
148.320
|
3.12.96
|
23.1.97
|
51
|
223,4
|
238,8
|
15,1
|
|
|
|
151.320
|
24.5.99
|
5.1.00
|
226
|
153,4
|
240,4
|
14,9
|
|
|
|
513.320
|
21.11.01
|
24.1.02
|
64
|
|
230,7
|
21,3
|
450/0
|
|
|
514.320
|
14.1.98
|
1.4.98
|
77
|
|
332,8
|
18,5
|
650/50
|
|
|
515.320
|
14.1.98
|
1.4.98
|
77
|
|
328,8
|
18,4
|
800/100
|
|
|
516.320
|
7.3.03
|
12.5.03
|
66
|
|
253,9
|
11,81)
|
800/200
|
Strength measured 17.4
|
|
517.320
|
7.3.03
|
13.5.03
|
67
|
|
219,8
|
11,71)
|
800/50
|
Strength measured 8.5
|
Table 4. Continued.
|
Test
|
Date of
|
Date of
|
Age at
|
Pcr
|
Pfail
|
Vg
|
c1/c2
|
Note
|
|
|
casting
|
loading
|
loading [d]
|
kN
|
kN
|
kN
|
|
|
|
159.370
|
21.10.02
|
18.11.02
|
28
|
-
|
252,7
|
19,8
|
500/100
|
|
|
160.370
|
9.10.02
|
6.11.02
|
28
|
-
|
286,4
|
19,8
|
700/250
|
|
|
161.370
|
9.10.02
|
6.11.02
|
28
|
-
|
262,4
|
19,8
|
750/300
|
|
|
162.400
|
28.4.93
|
17.8.93
|
111
|
186,4
|
287,4
|
26,7
|
|
1
|
|
178.400
|
28.10.99
|
20.1.00
|
84
|
-
|
269,4
|
21,9
|
1000/0
|
|
|
179.400
|
10.11.00
|
15.12.00
|
35
|
-
|
262,5
|
17,8
|
650/250
|
|
|
180.400
|
21.10.02
|
18.10.02
|
-3
|
-
|
305,0
|
19,9
|
760/180
|
|
|
188.400
|
28.11.97
|
29.1.98
|
62
|
187,4
|
271,4
|
21,5
|
|
|
|
518.400
|
29.10.99
|
8.12.99
|
40
|
|
432,7
|
22,2
|
900/350
|
|
|
519.400
|
29.10.99
|
8.12.99
|
40
|
|
507,0
|
18,6
|
750/180
|
Strength measured 10.12.
|
|
520.400
|
17.10.91
|
14.11.91
|
28
|
|
443,2
|
9,2
|
800/100
|
Strength measured 29.11.
|
|
521.400
|
17.10.91
|
14.11.91
|
28
|
|
382,0
|
9,2
|
800/100
|
Strength measured 29.11.
|
|
191.500
|
28.3.00
|
5.5.00
|
38
|
208,4
|
326,0
|
37,2
|
900/150
|
|
|
193.500
|
28.3.00
|
3.5.00
|
36
|
-
|
386,0
|
29,0
|
1000/150
|
|
|
194.500
|
3.4.00
|
4.5.00
|
31
|
-
|
452,0
|
28,3
|
1000/350
|
|
|
195.500
|
29.5.00
|
8.6.00
|
10
|
-
|
332,0
|
28,8
|
1350/150
|
|
|
198.500
|
8.1.01
|
22.3.01
|
73
|
-
|
442,0
|
29,2
|
750/250
|
|
|
199.500
|
4.6.02
|
31.7.02
|
57
|
-
|
528,0
|
29,6
|
900/250
|
|
|
200.500
|
4.6.02
|
2.8.02
|
59
|
-
|
485,0
|
29,8
|
1200/300
|
|
|
201.500
|
4.6.02
|
5.8.02
|
62
|
-
|
462,0
|
29,4
|
1200/400
|
|
Table 5. Observed shear resistance Vobs and shear resistance calculated using EC2 method (Vpre). Two different losses of prestress ( 5% and 15%) and two values of tensile strength have been assumed.
|
|
Mean tensile strength
|
Characteristic tensile strength
|
|
Loss of prestress
|
5%
|
15%
|
5%
|
15%
|
|
Slab
|
Vobs
kN
|
Vpre
kN
|

|
Vpre
kN
|
|
Vpre
kN
|
|
Vpre
kN
|
|
|
31.200
|
90.2
|
145.7
|
0.619
|
143.9
|
0.626
|
107.3
|
0.840
|
105.5
|
0.854
|
|
33.200
|
115.6
|
142.7
|
0.810
|
141.0
|
0.819
|
105.2
|
1.099
|
103.4
|
1.118
|
|
40.200
|
106.0
|
218.7
|
0.484
|
216.0
|
0.491
|
161.1
|
0.658
|
158.4
|
0.669
|
|
63.200
|
137.5
|
165.7
|
0.830
|
163.8
|
0.839
|
121.6
|
1.131
|
119.7
|
1.148
|
|
98.265
|
219.4
|
223.8
|
0.980
|
220.5
|
0.995
|
166.1
|
1.321
|
162.9
|
1.347
|
|
104.265
|
136.0
|
163.5
|
0.832
|
162.4
|
0.837
|
117.9
|
1.154
|
116.8
|
1.165
|
|
107.265
|
134.2
|
165.2
|
0.812
|
164.1
|
0.818
|
119.3
|
1.125
|
118.1
|
1.136
|
|
109.265
|
188.2
|
207.6
|
0.907
|
204.6
|
0.920
|
153.9
|
1.223
|
151.0
|
1.247
|
|
110.265
|
194.9
|
186.9
|
1.043
|
184.7
|
1.055
|
137.7
|
1.416
|
135.4
|
1.439
|
|
113.265
|
181.2
|
195.8
|
0.926
|
194.2
|
0.933
|
141.9
|
1.277
|
140.3
|
1.291
|
|
114.265
|
190.5
|
209.0
|
0.912
|
206.1
|
0.924
|
154.6
|
1.232
|
151.8
|
1.255
|
|
115.265
|
176.1
|
183.7
|
0.959
|
181.9
|
0.968
|
134.0
|
1.315
|
132.2
|
1.332
|
|
501.265
|
213.4
|
224.9
|
0.949
|
221.2
|
0.965
|
168.5
|
1.266
|
164.8
|
1.295
|
|
502.265
|
205.0
|
224.9
|
0.912
|
221.2
|
0.927
|
168.5
|
1.217
|
164.8
|
1.244
|
|
503.265
|
208.0
|
221.0
|
0.941
|
217.5
|
0.956
|
165.0
|
1.261
|
161.5
|
1.288
|
|
504.265
|
177.8
|
221.0
|
0.805
|
217.5
|
0.818
|
165.0
|
1.078
|
161.5
|
1.101
|
|
505.265
|
213.3
|
214.6
|
0.994
|
211.2
|
1.010
|
160.0
|
1.333
|
156.7
|
1.361
|
|
506.265
|
216.5
|
214.6
|
1.009
|
211.2
|
1.025
|
160.0
|
1.353
|
156.7
|
1.381
|
|
507.265
|
195.8
|
197.3
|
0.992
|
194.3
|
1.008
|
147.1
|
1.331
|
144.1
|
1.359
|
|
508.265
|
186.7
|
197.3
|
0.946
|
194.3
|
0.961
|
147.1
|
1.269
|
144.1
|
1.296
|
|
509.265
|
188.4
|
213.3
|
0.883
|
210.0
|
0.897
|
159.0
|
1.185
|
155.8
|
1.210
|
|
510.265
|
200.7
|
213.3
|
0.941
|
210.0
|
0.956
|
159.0
|
1.262
|
155.8
|
1.289
|
|
511.265
|
225.4
|
219.9
|
1.025
|
216.4
|
1.042
|
164.1
|
1.374
|
160.7
|
1.403
|
|
512.265
|
227.0
|
221.5
|
1.025
|
218.0
|
1.042
|
165.3
|
1.373
|
161.9
|
1.403
|
|
133.320
|
296.4
|
306.3
|
0.968
|
301.6
|
0.983
|
228.2
|
1.299
|
223.6
|
1.325
|
|
134.320
|
290.5
|
285.2
|
1.019
|
280.9
|
1.034
|
212.5
|
1.367
|
208.2
|
1.395
|
|
146.320
|
213.7
|
247.3
|
0.864
|
245.1
|
0.872
|
180.0
|
1.188
|
177.8
|
1.202
|
|
148.320
|
253.9
|
246.6
|
1.030
|
242.7
|
1.046
|
183.7
|
1.382
|
180.0
|
1.411
|
|
151.320
|
255.3
|
292.9
|
0.872
|
289.3
|
0.882
|
215.6
|
1.185
|
212.0
|
1.205
|
|
513.320
|
221.3
|
309.8
|
0.714
|
303.4
|
0.730
|
235.0
|
0.942
|
229.0
|
0.967
|
|
514.320
|
297.1
|
378.7
|
0.784
|
371.2
|
0.800
|
286.2
|
1.038
|
279.2
|
1.064
|
|
515.320
|
293.7
|
381.1
|
0.771
|
373.6
|
0.786
|
288.0
|
1.020
|
281.0
|
1.045
|
|
516.320
|
232.5
|
359.7
|
0.646
|
353.0
|
0.659
|
270.8
|
0.858
|
264.4
|
0.879
|
|
517.320
|
202.7
|
364.9
|
0.556
|
358.0
|
0.566
|
274.7
|
0.738
|
268.3
|
0.756
|
Table 5. Continued
|
|
Mean tensile strength
|
Characteristic tensile strength
|
|
Loss of prestress
|
5%
|
15%
|
5%
|
15%
|
|
Slab
|
Vobs
kN
|
Vpre
kN
|
|
Vpre
kN
|
|
Vpre
kN
|
|
Vpre
kN
|
|
|
160.370
|
306.2
|
396.2
|
0.773
|
389.4
|
0.786
|
296.9
|
1.031
|
290.4
|
1.054
|
|
161.370
|
282.2
|
402.1
|
0.702
|
395.2
|
0.714
|
301.3
|
0.937
|
294.7
|
0.958
|
|
162.400
|
314.1
|
432.1
|
0.727
|
423.8
|
0.741
|
325.8
|
0.964
|
318.0
|
0.988
|
|
178.400
|
291.3
|
475.4
|
0.613
|
465.7
|
0.626
|
360.1
|
0.809
|
351.0
|
0.830
|
|
188.400
|
292.9
|
381.7
|
0.768
|
375.7
|
0.780
|
284.5
|
1.030
|
278.7
|
1.051
|
|
518.400
|
394.9
|
500.9
|
0.788
|
490.0
|
0.806
|
381.6
|
1.035
|
371.2
|
1.064
|
|
519.400
|
444.0
|
500.9
|
0.886
|
490.0
|
0.906
|
381.6
|
1.164
|
371.2
|
1.196
|
|
520.400
|
345.2
|
458.8
|
0.753
|
450.0
|
0.767
|
345.5
|
0.999
|
337.4
|
1.023
|
|
521.400
|
391.2
|
458.8
|
0.853
|
450.0
|
0.869
|
345.5
|
1.132
|
337.4
|
1.159
|
|
191.500
|
363.2
|
694.4
|
0.523
|
679.4
|
0.535
|
528.6
|
0.687
|
514.2
|
0.706
|
|
193.500
|
415.0
|
718.3
|
0.578
|
702.6
|
0.591
|
547.1
|
0.759
|
532.1
|
0.780
|
|
198.500
|
471.2
|
702.5
|
0.671
|
687.5
|
0.685
|
534.5
|
0.882
|
520.1
|
0.906
|
|
199.500
|
557.6
|
717.7
|
0.777
|
700.1
|
0.796
|
551.3
|
1.011
|
534.9
|
1.042
|
|
200.500
|
514.8
|
721.8
|
0.713
|
704.0
|
0.731
|
554.7
|
0.928
|
538.1
|
0.957
|
|
201.500
|
491.4
|
709.5
|
0.693
|
692.1
|
0.710
|
545.1
|
0.902
|
528.8
|
0.929
|
Table 6. Observed shear resistance Vobs and shear resistance calculated using Yang’s method (Vpre). Two different losses of prestress (5% and 15%) and two values of tensile strength have been assumed.
|
|
Mean tensile strength
|
Characteristic tensile strength
|
|
Loss of prestress
|
5%
|
15%
|
5%
|
15%
|
|
Slab
|
Vobs
kN
|
Vpre
kN
|
|
Vpre
kN
|
|
Vpre
kN
|
|
Vpre
kN
|
|
|
31.200
|
90.2
|
128.040
|
0.704
|
126.690
|
0.712
|
93.1
|
0.969
|
92.0
|
0.980
|
|
33.200
|
115.6
|
124.560
|
0.928
|
123.340
|
0.937
|
90.2
|
1.281
|
89.3
|
1.294
|
|
40.200
|
106.0
|
193.440
|
0.548
|
190.550
|
0.556
|
142.9
|
0.742
|
140.4
|
0.755
|
|
63.200
|
137.5
|
148.070
|
0.928
|
146.080
|
0.941
|
108.9
|
1.263
|
107.2
|
1.283
|
|
98.265
|
219.4
|
223.660
|
0.981
|
218.810
|
1.003
|
169.8
|
1.292
|
165.4
|
1.327
|
|
104.265
|
136.0
|
149.470
|
0.910
|
148.080
|
0.918
|
108.7
|
1.251
|
107.4
|
1.266
|
|
107.265
|
134.2
|
154.460
|
0.869
|
152.710
|
0.879
|
113.2
|
1.185
|
111.6
|
1.202
|
|
109.265
|
188.2
|
202.300
|
0.930
|
198.280
|
0.949
|
152.6
|
1.234
|
148.9
|
1.264
|
|
110.265
|
194.9
|
185.820
|
1.049
|
182.170
|
1.070
|
139.9
|
1.393
|
136.7
|
1.426
|
|
113.265
|
181.2
|
181.470
|
0.999
|
179.530
|
1.009
|
132.6
|
1.367
|
130.8
|
1.386
|
|
114.265
|
190.5
|
205.210
|
0.928
|
201.120
|
0.947
|
154.7
|
1.231
|
151.0
|
1.261
|
|
115.265
|
176.1
|
172.850
|
1.019
|
170.650
|
1.032
|
127.1
|
1.386
|
125.1
|
1.408
|
|
501.265
|
213.4
|
217.170
|
0.983
|
212.560
|
1.004
|
164.5
|
1.297
|
160.4
|
1.330
|
|
502.265
|
205.0
|
217.170
|
0.944
|
212.560
|
0.965
|
164.5
|
1.247
|
160.4
|
1.278
|
|
503.265
|
208.0
|
224.940
|
0.925
|
219.450
|
0.948
|
172.5
|
1.206
|
167.5
|
1.242
|
|
504.265
|
177.8
|
224.940
|
0.791
|
219.450
|
0.810
|
172.5
|
1.031
|
167.5
|
1.062
|
|
505.265
|
213.3
|
216.830
|
0.984
|
211.740
|
1.007
|
165.7
|
1.287
|
161.1
|
1.324
|
|
506.265
|
216.5
|
216.830
|
0.998
|
211.740
|
1.022
|
165.7
|
1.306
|
161.1
|
1.344
|
|
507.265
|
195.8
|
196.010
|
0.999
|
191.690
|
1.021
|
149.0
|
1.314
|
145.1
|
1.349
|
|
508.265
|
186.7
|
196.010
|
0.953
|
191.690
|
0.974
|
149.0
|
1.253
|
145.1
|
1.287
|
|
509.265
|
188.4
|
213.920
|
0.881
|
209.040
|
0.901
|
163.1
|
1.155
|
158.7
|
1.188
|
|
510.265
|
200.7
|
213.920
|
0.938
|
209.040
|
0.960
|
163.1
|
1.231
|
158.7
|
1.265
|
|
511.265
|
225.4
|
213.500
|
1.056
|
209.110
|
1.078
|
161.3
|
1.397
|
157.4
|
1.432
|
|
512.265
|
227.0
|
216.740
|
1.047
|
212.120
|
1.070
|
164.3
|
1.382
|
160.1
|
1.418
|
|
133.320
|
296.4
|
304.610
|
0.973
|
298.270
|
0.994
|
230.9
|
1.284
|
225.0
|
1.317
|
|
134.320
|
290.5
|
286.280
|
1.015
|
280.190
|
1.037
|
217.2
|
1.337
|
211.6
|
1.373
|
|
146.320
|
213.7
|
245.990
|
0.869
|
240.850
|
0.887
|
186.9
|
1.143
|
182.0
|
1.174
|
|
148.320
|
253.9
|
239.700
|
1.059
|
234.120
|
1.085
|
183.0
|
1.388
|
177.9
|
1.427
|
|
151.320
|
255.3
|
282.920
|
0.902
|
276.940
|
0.922
|
214.2
|
1.192
|
208.8
|
1.223
|
|
513.320
|
221.3
|
243.210
|
0.910
|
241.980
|
0.915
|
173.6
|
1.275
|
172.6
|
1.282
|
|
514.320
|
297.1
|
322.890
|
0.920
|
318.580
|
0.932
|
238.0
|
1.248
|
233.8
|
1.271
|
|
515.320
|
293.7
|
325.060
|
0.903
|
320.700
|
0.916
|
239.6
|
1.226
|
235.4
|
1.248
|
|
516.320
|
232.5
|
317.230
|
0.733
|
312.410
|
0.744
|
234.9
|
0.990
|
230.2
|
1.010
|
|
517.320
|
202.7
|
320.080
|
0.633
|
315.370
|
0.643
|
236.7
|
0.856
|
232.1
|
0.873
|
Table 6. Continued.
|
|
Mean tensile strength
|
Characteristic tensile strength
|
|
Loss of prestress
|
5%
|
15%
|
5%
|
15%
|
|
Slab
|
Vobs
kN
|
Vpre
kN
|
|
Vpre
kN
|
|
Vpre
kN
|
|
Vpre
kN
|
|
|
160.370
|
306.2
|
373.790
|
0.819
|
367.270
|
0.834
|
280.9
|
1.090
|
274.4
|
1.116
|
|
161.370
|
282.2
|
380.950
|
0.741
|
374.140
|
0.754
|
286.7
|
0.984
|
279.9
|
1.008
|
|
162.400
|
314.1
|
338.710
|
0.927
|
337.670
|
0.930
|
241.2
|
1.302
|
240.0
|
1.309
|
|
178.400
|
291.3
|
443.970
|
0.656
|
434.480
|
0.670
|
331.5
|
0.879
|
324.2
|
0.899
|
|
188.400
|
292.9
|
360.550
|
0.812
|
354.270
|
0.827
|
266.9
|
1.098
|
261.2
|
1.122
|
|
518.400
|
394.9
|
405.680
|
0.973
|
401.820
|
0.983
|
292.0
|
1.352
|
289.8
|
1.363
|
|
519.400
|
444.0
|
405.680
|
1.095
|
401.820
|
1.105
|
292.0
|
1.521
|
289.8
|
1.532
|
|
520.400
|
345.2
|
384.550
|
0.898
|
381.030
|
0.906
|
277.3
|
1.245
|
274.9
|
1.256
|
|
521.400
|
391.2
|
384.550
|
1.017
|
381.030
|
1.027
|
277.3
|
1.411
|
274.9
|
1.423
|
|
191.500
|
363.2
|
541.330
|
0.671
|
539.860
|
0.673
|
379.0
|
0.958
|
379.9
|
0.956
|
|
193.500
|
415.0
|
548.300
|
0.757
|
547.820
|
0.758
|
380.9
|
1.089
|
382.9
|
1.084
|
|
198.500
|
471.2
|
565.680
|
0.833
|
562.330
|
0.838
|
401.3
|
1.174
|
400.3
|
1.177
|
|
199.500
|
557.6
|
538.640
|
1.035
|
538.090
|
1.036
|
373.3
|
1.494
|
375.7
|
1.484
|
|
200.500
|
514.8
|
536.110
|
0.960
|
536.190
|
0.960
|
370.1
|
1.391
|
373.1
|
1.380
|
|
201.500
|
491.4
|
535.640
|
0.917
|
534.780
|
0.919
|
372.1
|
1.321
|
374.2
|
1.313
|
References
1. BBK 79 Bestämmelser för betongkonstruktioner, Band 1, Konstruktion. Stockholm: Statens betongkommitté, 1979. 157 p. ISBN: 91-7332-087-0.
2. CEB Bulletin 228. High Performance Concrete – Recommended Extensions to the Model Code 90 – Research Needs, 1995. Comité Euro-International du Béton. 60 p. ISBN: 2-88394-031-21995.
3. CP100: Part 1: November 1972. Code of practice fo the structural use of concrete. London: British Standards Institution, November 1972. ISBN: 0 580 07488 9.
4. EN 1168. Precast concrete products – Hollow core slabs. 2005.
5. EN 1992-1-1. Eurocode 2: Design of concrete structures – Part 1: General rules and rules for buildings. 2004.
6. Fellinger, J. Shear and anchorage behaviour of fire exposed hollow core slabs. Delft: Delft University Press, 2004. 234 p. + app. 26 p. ISBN: 90-407-2482-2.
7. FIP Recommendations "Precast prestressed hollow core floors". London: Thomas Telford, 1988. 31 p. ISBN: 0 7277 1375 2.
8. Pajari, M. Design of prestressed hollow core slabs. Espoo: Technical Research Centre of Finland, 1989. Research Reports 657. 88 p. + app. 38 p. ISBN 951-38-3539-1.
9. Walraven, J. C. & Mercx, W. P. M. The bearing capacity of prestressed hollow core slabs. Heron 1983. Vol. 28, No. 3. 46 p.
10. Yang, L. Design of Prestressed Hollow core Slabs with Reference to Web Shear Failure. ASCE Journal of Structural Engineering, 1994. Vol. 120, No. 9, pp. 2675–2696.
|