|
Leviäkangas, Pekka, Lehtinen, Jarkko, Berg, Inna & Alaruikka, Anna-Maija
VTT Building and Transport, Kaitoväylä 1, P.O. Box 18021, FI-90571 Oulu, Finland

VTT Research Notes 2293, April 2005, 72 p.
[in English, Finnish abstr. ]
ISBN 951–38–6550–9
(soft back ed.)
ISBN 951–38–6551–7 (PDF edition)
951–38–6550–9 (nid.)951–38–6551–7
Project: Pol-Corridor
Commissioned by TEKES (Elo-programme), LVM, the harbours of Turku, Helsinki, Kotka and Hamina, Finnlines Ltd.
Keywords: corridors, intermodal transport, freight flow, Polcorridor, train services, North Europe, South Europe, market assessment,
feasibility, economy
Abstract
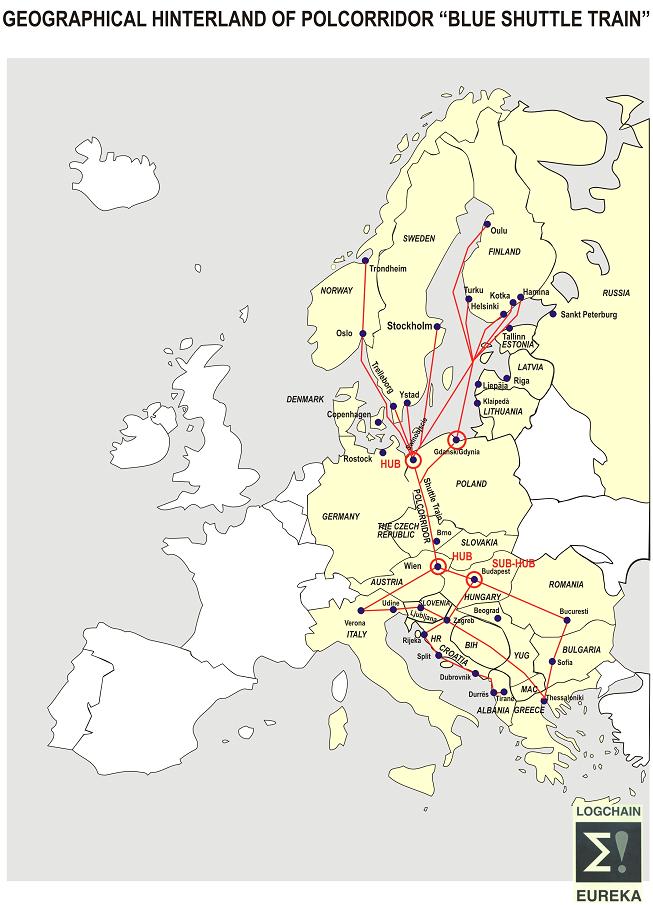
This report describes the prospects of a new trans-European freight supply network stretching from the Nordic countries to
Central, Southern and South-eastern Europe. The northern part of the corridor consists of sea-land connections from Sweden, Finland and Norway to an intermodal hub in Poland. From there, the corridor connects
via a regularly scheduled block train – the ”Blue Shuttle Train” – to an intermodal hub in Vienna. The southern part of the corridor comprises the existing land connections to destinations in most
of Central, Southern and South-eastern Europe.
This report covers results of Work Package 1 of the Pol-Corridor project, assessing the demand for Blue Shuttle Train’s services
in North and South European markets. The main objectives of the work were to assess the freight volumes currently shipped
in the North-South direction and to forecast the international freight volumes in the near future.
First, the assessment of Pol-Corridor’s potential for carrying Finnish flows and the method for assessment are presented. Most of the potential destination countries can be identified as well as the countries that are insignificant
for the Pol-Corridor concept. Also the maximum and minimum potential for Blue Shuttle Train and the issue of balanced transportation in North-South directions are discussed.
Second, the potential for Nordic flows has been assessed by using the same method presented with the Finnish flows. This assessment
provides deeper insight to possible future development. Scenarios projected till the beginning of 2006 are defined in order
to probe the business potential for Blue Shuttle Train.
It can be concluded that Pol-Corridor and Blue Shuttle Train will be an alternative for international north-south logistics
provided if either of the following clauses is fulfilled: 1) many countries at the south-end of Pol-Corridor will direct their
Northbound flows to Blue Shuttle Train instead of to trailers on roads or 2) Austrian and Italian exports will use Blue Shuttle Train and Pol-Corridor in their Northbound transport.
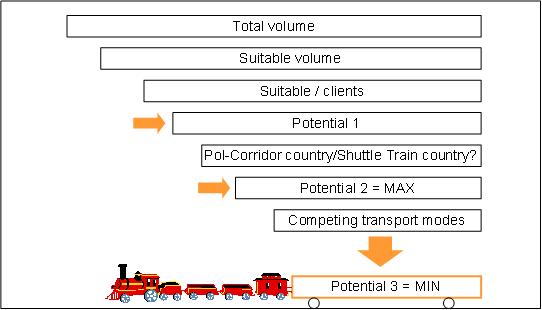
Figures and Tables Figure 1. PolCorridor Overall System Chart (Ludvigsen, 2003). 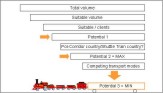 Figure 2. Data refining process.
Table 1. Pol-Corridor relevant players in Finland.
|
Player, organisations
|
Primary interest, task
|
|
Ministry of Transport and Communication Finland
|
Support for export and import trade routes that serve the competitiveness of Finnish industries
|
|
Finnlines Ltd
|
Sea carrier; optimising Baltic Sea routes and efficient utilisation of vessel capacity
|
|
Ports of Helsinki, Turku, Kotka, Hamina and Oulu
|
Providing facilities for potential goods flows according to their geographical location and special features
|
|
Paper product producing cluster: StoraEnso, M-Real, UPM-Kymmene
|
Creating efficient supply chains for Pol-Corridor markets
|
|
Metal product producing cluster: Rautaruukki, AvestaPolarit
|
Creating efficient supply chains for Pol-Corridor markets
|
|
Finnish and multi-national forwarders and transporters cluster
|
Finding cost efficient and reliable trade routes for their clients
|
|
Importing and exporting SMEs
|
These companies many times lack a structured logistics system. A concept like Pol-Corridor could answer to their needs and could lower their logistics costs.
|
Table 2. Some important Finnish ports and their special areas of interest.
|
Port
|
Relevant port-to-port destinations/origins
|
Special focus
|
Statistics & Notes
|
|
Helsinki
|
Stockholm, Helsingborg, Tallinn, Gdynia, Szcecin, Lubeck, Travemunde, Rostock, Bremerhaven, Antwerp, Zeebrugge, Amsterdam, Rotterdam, Pireues, Istanbul.
|
Specializes in unitized cargo transport. Biggest unitized cargo port in Finland.
|
Over 9 million passengers and over 10 million tons of cargo each year.
|
|
Turku
|
Stockholm, Bremerhaven, Hamburg, Travemünde, Antwerpen, Gdansk.
|
Facilities and equipment to serve trains, lorries and trailers in both Scandinavian and continental transport.
|
More than 4 mill. tonnes and over 4 mill. Passengers annually.
Mann Lines Oy has opened a new shipping line Turku–Tallinn–Gdansk–Kiel–Bremerhaven–Kiel–Turku.
|
|
Kotka
|
Antwerpen, Fredericia, Tallinn, Bremen, Bremerhaven, Hamburg, Lübeck, Rostock, Elefsis, Heraklion, Patras, Piraeus, Salonica, Stylis, Marina di Carrara, Rotterdam, Amsterdam/Zaandam/Ouderkerk, Gdynia, Istanbul, Mersin.
|
Paper products and transit to/from Russia
|
More than 8 mill. tonnes per year.
|
|
Hamina
|
Antwerp, Copenhagen/Århus, Hamburg, Bremerhaven, Bremen, Hamburg, Lübeck, Amsterdam, Rotterdam, Terneuzen.
|
Specialised in forest products, containers and liquid bulk. Liquid bulk export is the main cargo group in transit transport (transit 24 % of total cargo
tonnes) from Russia.
|
Annual transport of 5 million tonnes. In 2002 forest industry exports 49 %, forest industry related imports (3 %). 17 % is unitised cargo.
|
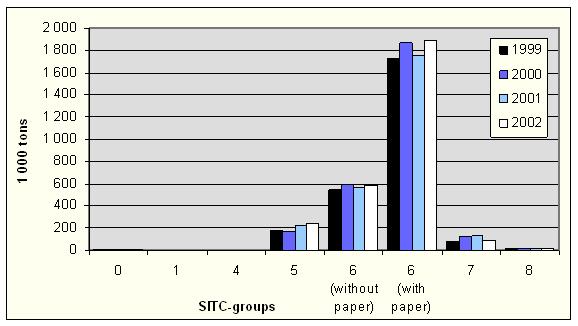
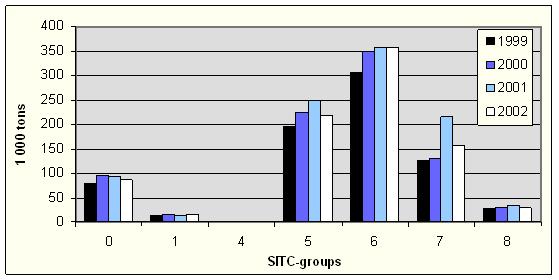
Table 3. Total Finnish export volumes to Pol-Corridor countries, 1 000 tons (Finnish Customs 2002).
|
SITC_1
|
1999
|
2000
|
2001
|
2002
|
99–01
|
99–02
|
|
0. Food and live animals
|
13
|
14
|
20
|
17
|
54 %
|
33 %
|
|
1. Beverages and tobacco
|
4
|
2
|
3
|
4
|
–18 %
|
5 %
|
|
2. Crude materials, inedible, except fuels
|
698
|
654
|
655
|
702
|
–6 %
|
1 %
|
|
3. Mineral fuels, lubricants and related materials
|
357
|
38
|
16
|
36
|
–96 %
|
–90 %
|
|
4. Animal and vegetable oils, fats and waxes
|
0
|
3
|
1
|
3
|
118 %
|
488 %
|
|
5. Chemicals and related products
|
182
|
175
|
221
|
242
|
22 %
|
33 %
|
|
6. Manufactured goods
|
1 725
|
1 866
|
1 762
|
1 893
|
2 %
|
10 %
|
|
7. Machinery and transport equipment
|
77
|
123
|
134
|
89
|
74 %
|
13 %
|
|
8. Miscellaneous manufactured articles
|
19
|
22
|
24
|
19
|
26 %
|
0 %
|
|
Total
|
3 075
|
2 897
|
2 836
|
3 005
|
–8 %
|
–2 %
|
Table 4. Total Finnish import volumes from Pol-Corridor countries, 1 000 tons (Finnish Customs 2002).
|
SITC_1
|
1999
|
2000
|
2001
|
2002
|
99–01
|
99–02
|
|
0. Food and live animals
|
79
|
98
|
97
|
90
|
22 %
|
14 %
|
|
1. Beverages and tobacco
|
14
|
15
|
13
|
15
|
–8 %
|
4 %
|
|
2. Crude materials, inedible, except fuels
|
150
|
149
|
110
|
115
|
–27 %
|
–23 %
|
|
3. Mineral fuels, lubricants and related materials
|
2 161
|
2 360
|
2 566
|
1 922
|
19 %
|
–11 %
|
|
4. Animal and vegetable oils, fats and waxes
|
0
|
1
|
1
|
1
|
2 %
|
58 %
|
|
5. Chemicals and related products
|
195
|
225
|
250
|
218
|
28 %
|
12 %
|
|
6. Manufactured goods
|
307
|
350
|
357
|
357
|
16 %
|
16 %
|
|
7. Machinery and transport equipment
|
126
|
128
|
216
|
156
|
72 %
|
21 %
|
|
8. Miscellaneous manufactured articles
|
25
|
28
|
34
|
30
|
34 %
|
17 %
|
|
Total
|
3 057
|
3 354
|
3 644
|
2 904
|
19 %
|
–5 %
|
Table 5. Finnish trade with Pol-Corridor countries 1999–2002, 1 000 tons (Finnish Customs 2002).
|
FINNISH TRADE
|
EXPORTS
|
|
IMPORTS
|
|
|
1999
|
2000
|
2001
|
2002
|
99–02
|
|
1999
|
2000
|
2001
|
2002
|
99–02
|
|
Albania
|
2
|
1
|
3
|
2
|
–22 %
|
|
0
|
0
|
0
|
0
|
0 %
|
|
Austria
|
287
|
296
|
288
|
272
|
–5 %
|
|
90
|
102
|
98
|
103
|
14 %
|
|
Bosnia-Herzegovina
|
1
|
0
|
0
|
1
|
1 %
|
|
5
|
1
|
2
|
0
|
–100 %
|
|
Bulgaria
|
19
|
20
|
20
|
22
|
14 %
|
|
9
|
29
|
6
|
11
|
22 %
|
|
Croatia
|
8
|
11
|
13
|
15
|
80 %
|
|
0
|
1
|
5
|
2
|
307 %
|
|
Czech
Republic
|
85
|
113
|
90
|
115
|
36 %
|
|
68
|
75
|
135
|
124
|
82 %
|
|
Greece
|
252
|
248
|
255
|
298
|
18 %
|
|
61
|
45
|
88
|
51
|
–17 %
|
|
Hungary
|
101
|
128
|
144
|
140
|
39 %
|
|
38
|
44
|
43
|
40
|
4 %
|
|
Italy
|
1 163
|
1 160
|
1 171
|
1 149
|
–1 %
|
|
256
|
272
|
318
|
304
|
19 %
|
|
Macedonia
|
2
|
1
|
1
|
1
|
–65 %
|
|
0
|
0
|
0
|
0
|
76 %
|
|
Poland
|
840
|
552
|
590
|
664
|
–21 %
|
|
2 406
|
2 646
|
2 808
|
2 133
|
–11 %
|
|
Romania
|
13
|
14
|
13
|
14
|
3 %
|
|
2
|
10
|
12
|
12
|
536 %
|
|
Slovakia
|
60
|
61
|
71
|
74
|
23 %
|
|
18
|
20
|
21
|
27
|
53 %
|
|
Slovenia
|
22
|
22
|
17
|
15
|
–30 %
|
|
6
|
9
|
9
|
9
|
48 %
|
|
Turkey
|
218
|
267
|
159
|
219
|
0 %
|
|
97
|
99
|
98
|
87
|
–9 %
|
|
Yugoslavia
|
2
|
3
|
1
|
4
|
80 %
|
|
1
|
1
|
1
|
1
|
68 %
|
|
Total
|
3 075
|
2 897
|
2 836
|
3 005
|
–2 %
|
|
3 057
|
3 354
|
3 644
|
2 904
|
–5 %
|
Table 6. Sea transport between Finland and some Pol-Corridor countries in 2002, 1 000 tons (Finnish Maritime Administration).
|
Country
|
Sea transport to
|
% exports
|
Sea transport from
|
% imports
|
|
Italy
|
346
|
30
|
28
|
9
|
|
Greece
|
213
|
71
|
31
|
61
|
|
Turkey
|
102
|
47
|
56
|
64
|
|
Poland
|
779
|
117
|
2 266
|
106
|
Table 7. Annual expected growth in export for 2002–2006 (source: EIU).
|
Annual export growth
|
2002
|
2003
|
2004
|
2005
|
2006
|
|
Austria
|
2.7 %
|
4.5 %
|
5.1 %
|
5.3 %
|
5.4 %
|
|
Bulgaria
|
0.4 %
|
3.6 %
|
6.5 %
|
8.5 %
|
9.3 %
|
|
Croatia
|
6.8 %
|
6.5 %
|
6.7 %
|
na
|
na
|
|
Czech rep
|
5.1 %
|
11.5 %
|
10.9 %
|
10.1 %
|
9.4 %
|
|
Finland
|
3.2 %
|
5.2 %
|
6.6 %
|
7.1 %
|
6.1 %
|
|
Greece
|
4.4 %
|
5.3 %
|
6.2 %
|
6.0 %
|
5.2 %
|
|
Hungary
|
6.9 %
|
8.1 %
|
14.5 %
|
12.1 %
|
7.0 %
|
|
Italy
|
–0.3 %
|
2.2 %
|
3.5 %
|
3.1 %
|
2.2 %
|
|
Norway
|
2.4 %
|
2.6 %
|
3.1 %
|
3.0 %
|
2.9 %
|
|
Poland
|
3.5 %
|
6.5 %
|
10.3 %
|
8.2 %
|
7.8 %
|
|
Slovakia
|
4.2 %
|
10.6 %
|
8.8 %
|
10.1 %
|
8.6 %
|
|
Slovenia
|
4.9 %
|
6.8 %
|
6.5 %
|
na
|
na
|
|
Sweden
|
2.5 %
|
4.3 %
|
4.7 %
|
5.0 %
|
5.1 %
|
|
Romania
|
8.7 %
|
7.3 %
|
7.0 %
|
5.0 %
|
6.0 %
|
|
Russia
|
4.0 %
|
4.0 %
|
5.0 %
|
6.0 %
|
6.0 %
|
|
Turkey
|
5.1 %
|
5.4 %
|
6.7 %
|
6.4 %
|
5.9 %
|
Table 8. Annual expected growth in import for 2002–2006 (source: EIU).
|
Annual import growth
|
2002
|
2003
|
2004
|
2005
|
2006
|
|
Austria
|
1.0 %
|
4.7 %
|
5.8 %
|
5.8 %
|
5.9 %
|
|
Bulgaria
|
2.4 %
|
5.2 %
|
6.9 %
|
8.5 %
|
9.3 %
|
|
Croatia
|
4.0 %
|
6.4 %
|
6.9 %
|
na
|
na
|
|
Czech rep
|
4.7 %
|
11.7 %
|
10.3 %
|
8.8 %
|
8.2 %
|
|
Finland
|
0.0 %
|
6.2 %
|
9.1 %
|
8.2 %
|
8.0 %
|
|
Greece
|
6.0 %
|
7.9 %
|
6.8 %
|
5.9 %
|
5.6 %
|
|
Hungary
|
9.1 %
|
10.6 %
|
12.3 %
|
12.6 %
|
5.4 %
|
|
Italy
|
–0.1 %
|
3.0 %
|
4.0 %
|
3.5 %
|
3.1 %
|
|
Norway
|
3.5 %
|
3.7 %
|
3.7 %
|
3.0 %
|
2.4 %
|
|
Poland
|
1.5 %
|
5.9 %
|
8.8 %
|
8.3 %
|
8.0 %
|
|
Slovakia
|
3.0 %
|
9.1 %
|
8.1 %
|
8.5 %
|
8.4 %
|
|
Slovenia
|
5.2 %
|
7.6 %
|
7.0 %
|
na
|
na
|
|
Sweden
|
0.4 %
|
4.6 %
|
5.2 %
|
5.6 %
|
5.6 %
|
|
Romania
|
6.9 %
|
8.0 %
|
9.0 %
|
7.0 %
|
7.0 %
|
|
Russia
|
9.0 %
|
6.0 %
|
8.0 %
|
7.0 %
|
8.0 %
|
|
Turkey
|
7.5 %
|
7.4 %
|
9.0 %
|
8.1 %
|
8.9 %
|
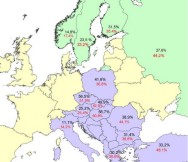 Figure 3. Cumulative expected growth in export or import between 2002 and 2006. (Upper figure is export, lower figure is import;
source EIU.)
Table 9. Annual expected growth in private consumption and cumulative growth for 2002–2006 (source: EIU).
|
Real growth in private consumption (%)
|
2002
|
2003
|
2004
|
2005
|
2006
|
2002–2006
cumulative
|
|
Austria
|
1.1 %
|
1.6 %
|
2.2 %
|
2.1 %
|
2.1 %
|
9.4 %
|
|
Bulgaria
|
3.6 %
|
3.8 %
|
4.0 %
|
4.0 %
|
3.9 %
|
20.8 %
|
|
Croatia
|
5.6 %
|
3.7 %
|
4.0 %
|
na
|
na
|
13.9 %*
|
|
Finland
|
2.0 %
|
2.4 %
|
2.7 %
|
2.8 %
|
2.8 %
|
13.4 %
|
|
Greece
|
3.0 %
|
3.2 %
|
3.2 %
|
3.4 %
|
3.2 %
|
17.1 %
|
|
Hungary
|
7.1 %
|
5.3 %
|
3.9 %
|
3.7 %
|
3.7 %
|
26.0 %
|
|
Italy
|
0.1 %
|
1.9 %
|
2.2 %
|
2.0 %
|
2.1 %
|
8.6 %
|
|
Norway
|
2.9 %
|
3.0 %
|
3.0 %
|
2.8 %
|
2.5 %
|
15.0 %
|
|
Poland
|
2.4 %
|
2.9 %
|
3.2 %
|
3.7 %
|
3.9 %
|
17.2 %
|
|
Slovakia
|
5.8 %
|
4.2 %
|
4.3 %
|
4.9 %
|
4.6 %
|
26.2 %
|
|
Slovenia
|
2.2 %
|
3.5 %
|
3.3 %
|
na
|
na
|
9.3 %*
|
|
Sweden
|
2.0 %
|
2.2 %
|
2.6 %
|
2.5 %
|
2.4 %
|
12.3 %
|
|
Romania
|
2.6 %
|
3.6 %
|
4.3 %
|
3.5 %
|
2.7 %
|
17.8 %
|
|
Russia
|
7.5 %
|
5.5 %
|
4.5 %
|
4.0 %
|
4.0 %
|
28.2 %
|
|
Turkey
|
1.0 %
|
3.8 %
|
4.2 %
|
4.4 %
|
4.9 %
|
19.6 %
|
|
Czech republic
|
4.1 %
|
4.8 %
|
4.3 %
|
3.8 %
|
3.5 %
|
22.2 %
|
Table 10. Finnish trade with Pol-Corridor countries, 1 000 tons; export without paper products (Finnish Customs 2002).
|
|
EXPORTS
|
IMPORTS
|
|
SITC groups
|
-99
|
-00
|
-01
|
-02
|
-99–02
|
-99
|
-00
|
-01
|
-02
|
-99–02
|
|
0. Food and live animals
|
7*
|
8*
|
12
|
9
|
33 %
|
77*
|
95*
|
94
|
86
|
14 %
|
|
1. Beverages and tobacco
|
4
|
2
|
3
|
4
|
5 %
|
14
|
15
|
13
|
15
|
4 %
|
|
2. Crude materials, inedible, except fuels
|
0
|
3
|
1
|
3
|
488 %
|
0
|
1
|
1
|
1
|
58 %
|
|
3. Mineral fuels, lubricants and related materials
|
182
|
175
|
221
|
242
|
33 %
|
195
|
225
|
250
|
218
|
12 %
|
|
4. Animal and vegetable oils, fats and waxes
|
544*
|
599*
|
561
|
582
|
10 %
|
307
|
350
|
357
|
357
|
16 %
|
|
5. Chemicals and related products
|
77
|
123
|
134
|
89
|
13 %
|
126
|
128
|
156
|
156
|
21 %
|
|
6. Manufactured goods
|
19
|
22
|
24
|
19
|
0 %
|
26
|
28
|
34
|
30
|
17 %
|
|
Total
|
833
|
932
|
965
|
948
|
14 %
|
745
|
842
|
863
|
863
|
16 %
|
Table 11. Finnish trade with Pol-Corridor countries, 1 000 tons; export with paper products (Finnish Customs 2002).
|
|
EXPORTS
|
IMPORTS
|
|
SITC groups
|
-99
|
-00
|
-01
|
-02
|
-99–02
|
-99
|
-00
|
-01
|
-02
|
-99–02
|
|
0. Food and live animals
|
7*
|
8*
|
12
|
9
|
33 %
|
77*
|
95*
|
94
|
86
|
14 %
|
|
1. Beverages and tobacco
|
4
|
2
|
3
|
4
|
5 %
|
14
|
15
|
13
|
15
|
4 %
|
|
2. Crude materials, inedible, except fuels
|
0
|
3
|
1
|
3
|
488 %
|
0
|
1
|
1
|
1
|
58 %
|
|
3. Mineral fuels, lubricants and related materials
|
182
|
175
|
221
|
242
|
33 %
|
195
|
225
|
250
|
218
|
12 %
|
|
4. Animal and vegetable oils, fats and waxes
|
1 725
|
1 866
|
1 762
|
1 893
|
10 %
|
307
|
350
|
357
|
357
|
16 %
|
|
5. Chemicals and related products
|
77
|
123
|
134
|
89
|
13 %
|
126
|
128
|
156
|
156
|
21 %
|
|
6. Manufactured goods
|
19
|
22
|
24
|
19
|
0 %
|
26
|
28
|
34
|
30
|
17 %
|
|
Total
|
2 011
|
2 198
|
2 160
|
2 258
|
12 %
|
745
|
842
|
863
|
863
|
16 %
|
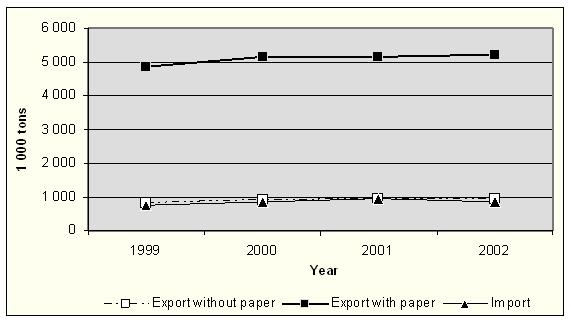
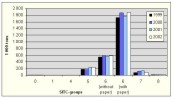 Figure 4. Total Finnish export volumes to Pol-Corridor countries, 1 000 tons (Finnish Customs 2002). 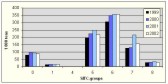 Figure 5. Total Finnish import volumes to Pol-Corridor countries, 1 000 tons (Finnish Customs 2002). 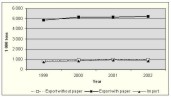 Figure 6. Balance between export and import.
Table 12. Finnish export with Pol-Corridor countries 2001–2002, 1 000 tons; with paper products (Finnish Customs 2002).
|
FINNISH TRADE
|
EXPORTS
|
|
|
1999
|
2000
|
2001
|
2002
|
-99–02
|
|
Austria
|
209
|
215
|
214
|
212
|
1,5 %
|
|
Balkan countries
|
6
|
5
|
5
|
6
|
–7 %
|
|
Bulgaria
|
19
|
19
|
20
|
20
|
6 %
|
|
Croatia
|
8
|
10
|
13
|
15
|
83 %
|
|
Czech Republic
|
69
|
109
|
85
|
90
|
30 %
|
|
Greece
|
171
|
169
|
179
|
192
|
12 %
|
|
Hungary
|
91
|
115
|
126
|
127
|
39 %
|
|
Italy
|
767
|
820
|
836
|
811
|
6 %
|
|
Poland
|
400
|
441
|
459
|
499
|
25 %
|
|
Romania
|
13
|
14
|
13
|
14
|
6 %
|
|
Slovakia
|
58
|
58
|
68
|
69
|
19 %
|
|
Slovenia
|
16
|
16
|
14
|
13
|
–17 %
|
|
Turkey
|
183
|
206
|
130
|
191
|
4 %
|
|
Total
|
2 011
|
2 199
|
2 160
|
2 258
|
12 %
|
Table 13. Relevant Finnish trade with Pol-Corridor countries 1999–2002, 1 000 tons; export without paper products (Finnish Customs 2002).
|
|
EXPORTS
|
IMPORTS
|
|
FINNISH TRADE
|
-99
|
-00
|
-01
|
-02
|
-99–02
|
-99
|
-00
|
-01
|
-02
|
-99–02
|
|
Austria
|
86
|
89
|
78
|
96
|
12 %
|
75
|
88
|
86
|
90
|
21 %
|
|
Balkan countries
|
6
|
2
|
1
|
2
|
–96 %
|
7
|
2
|
3
|
2
|
–74 %
|
|
Bulgaria
|
4
|
3
|
4
|
7
|
76 %
|
4
|
18
|
3
|
2
|
–32 %
|
|
Croatia
|
2
|
3
|
4
|
3
|
29 %
|
1
|
0
|
4
|
1
|
117 %
|
|
Czech Republic
|
39
|
55
|
72
|
47
|
20 %
|
64
|
72
|
130
|
75
|
19 %
|
|
Greece
|
44
|
30
|
46
|
43
|
–2 %
|
31
|
43
|
59
|
51
|
63 %
|
|
Hungary
|
23
|
32
|
32
|
31
|
33 %
|
31
|
35
|
32
|
32
|
2 %
|
|
Italy
|
359
|
420
|
424
|
379
|
6 %
|
254
|
270
|
313
|
300
|
18 %
|
|
Poland
|
195
|
203
|
229
|
239
|
23 %
|
207
|
240
|
242
|
232
|
12%
|
|
Romania
|
4
|
5
|
4
|
6
|
56 %
|
1
|
1
|
12
|
2
|
23 %
|
|
Slovakia
|
13
|
12
|
14
|
15
|
11 %
|
17
|
20
|
20
|
25
|
45 %
|
|
Slovenia
|
5
|
5
|
4
|
5
|
3 %
|
6
|
9
|
9
|
9
|
58 %
|
|
Turkey
|
54
|
69
|
54
|
76
|
40 %
|
49
|
46
|
51
|
42
|
–14 %
|
|
Total
|
833
|
932
|
965
|
948
|
14 %
|
745
|
844
|
965
|
863
|
16 %
|
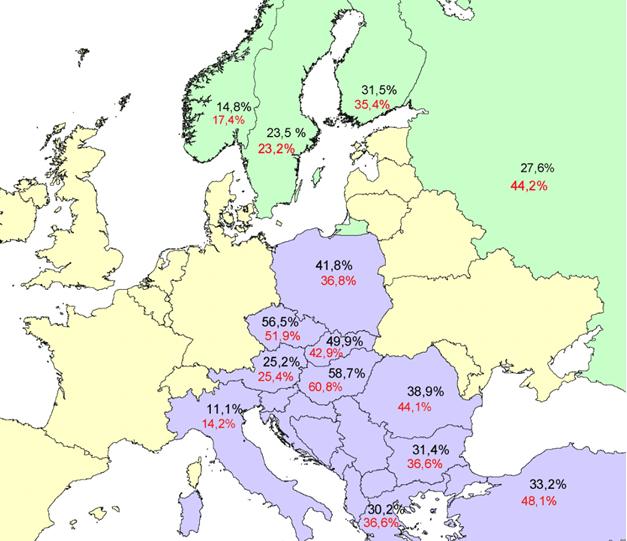
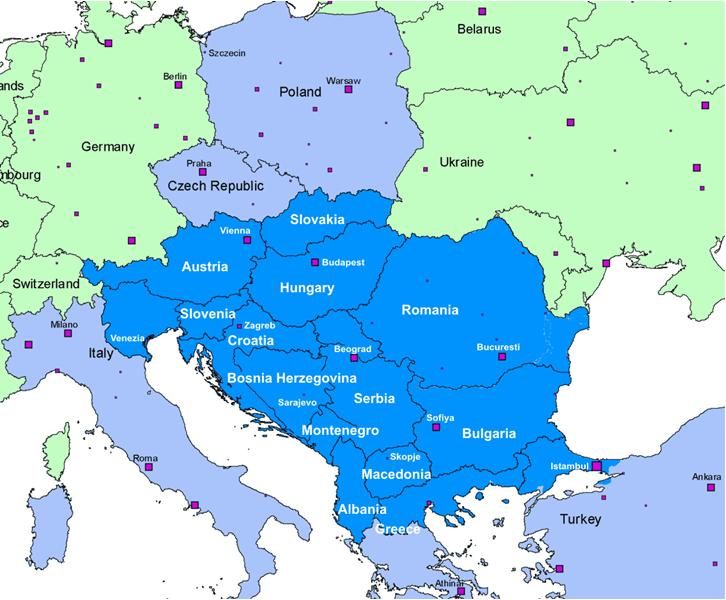
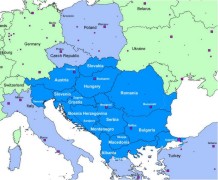 Figure 7. Southern POL-CORRIDOR markets, entire south Eastern European region (light blue) and core hinterland area (dark
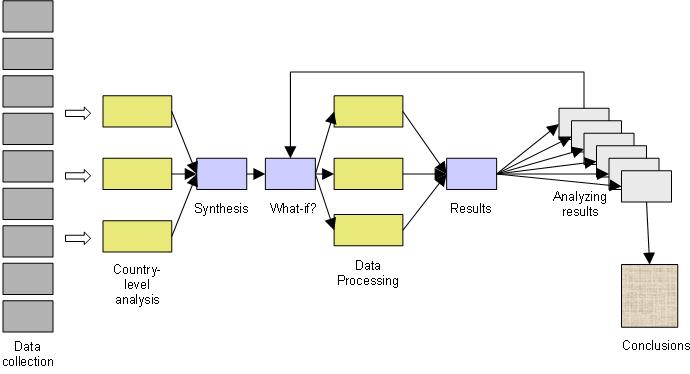
blue). Cities with population more than 250 000 are marked. 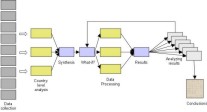 Figure 8. The Market Potential Analysis Process.
Literature
Alho, K., Hazley, C., Hernesniemi, H. & Widgrén, M. 2001. EU:n itälaajentumisen vaikutukset Suomen tuotantorakenteeseen (The
Effects of EU Eastern Enlargement on Finnish Firms [with English summary]). The Research Institute of the Finnish Economy, ETLA, Discussion papers No. 752. Helsinki.
Alho, K., Kaitila, V. & Widgren, M. 2001 EU:n itälaajenemisen vaikutukset Suomen elinkeinoelämälle. (The Effects of EU Eastern Enlargement on Finnish Firms [with English summary]). The Research Institute of the Finnish Economy, ETLA, Series B 178. Helsinki.
Finnish Board of Customs, statistics 1999–2002. Direct information from Customs’ register.
Finnish Maritime Administration. Martina database.
FRISBEE. European transport network model owned by the Ministry of Transport and Communications Finland.
http://www.etla.fi/finnish/research/publications/searchengine/pdf/abstract/b178eng.pdf
http://www.etla.fi/finnish/research/publications/searchengine/pdf/dp/dp752.pdf
http://www.fma.fi/palvelut/tietopalvelut/tilastot/martina/
Järventaus, J.-P. 2001. Aasian talouskeskukset imevät paperia. UPM-Kymmene Watch, 2/2001. Pp. 15–17.
Ludvigsen, Johanna. 2003. Revised Master Plan for PolCorridor Project. 8th revised, scientific version. 28.5.2003. Unpublished working paper.
Interviews:
Avesta Polarit Oyj Abp, 16.6.2003. Sjaap Klap.
Finnlines Oyj, Spring 2003. Rainer Merus; several interviews.
Finnlines Oyj, 25.2.2003. Rainer Merus, Jarkko Sainio, Heidi Roering-Nordberg.
JIT-Trans, 30.5.2003. Reijo Ojala.
StoraEnso Oyj, 22.5.2003. Kari Anttila.
In-depth interviews for Chapter 6 POL-CORRIDOR Potential Assessment, Finnish Flows:
Rahtihuolinta Suomi Oy, 20.5. and 2.7.2003. Tapio Talasterä.
Oy Beweship Ab, 4.6.2003. Arto Tuominen, Stig Lönnberg.
UPS Supply Chain Solutions Oy, 6.6.2003. Päivi Kyllönen.
Danzas ASG Eurocargo Oy, 5.6.2003. Maarit Pitkänen, Jussi Heikkilä.
Schenker Oy, 6.6.2003. Bjarne Karlsson, Henri Chapelle.
Finnlines Oyj, 19.6.2003. Jarkko Saarnio, Rainer Merus, Heidi Roering-Nordberg.
|